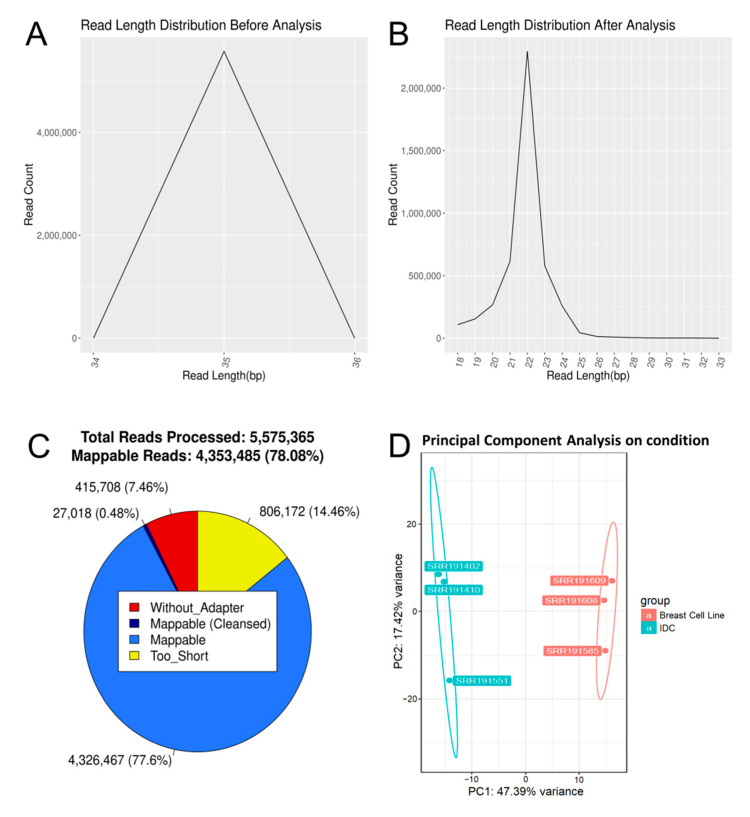
Figure 3.
DIANA-mAP visualization results. (A) Raw reads length distribution (SRR033716). (B) Pre-processed (mappable) reads length distribution (SRR033716). (C) Pie-Chart showing the fractions of filtered and mappable reads after the pre-processing step of the analysis (SRR033716). Mappable reads (Cleansed) are reads that were cleansed of partial adapter sequences through pre-processing loops (see Section 2.2.1). “Without_Adapter” are reads in which no adapter was found, while “Too_Short” are reads that had very low number of base pairs (based on configuration) after adapter trimming and were consequently excluded from further analysis. (D) Differential Expression Analysis PCA graph for a group of 6 analyzed samples of a miRNA expression study on breast tumors. The three orange-colored samples (SRR191585, SRR191608 and SRR191609) originate from a breast cell line while the three teal-colored ones (SRR191402, SRR191410 and SRR191551) originate from invasive ductal carcinoma (IDC) tissues.

