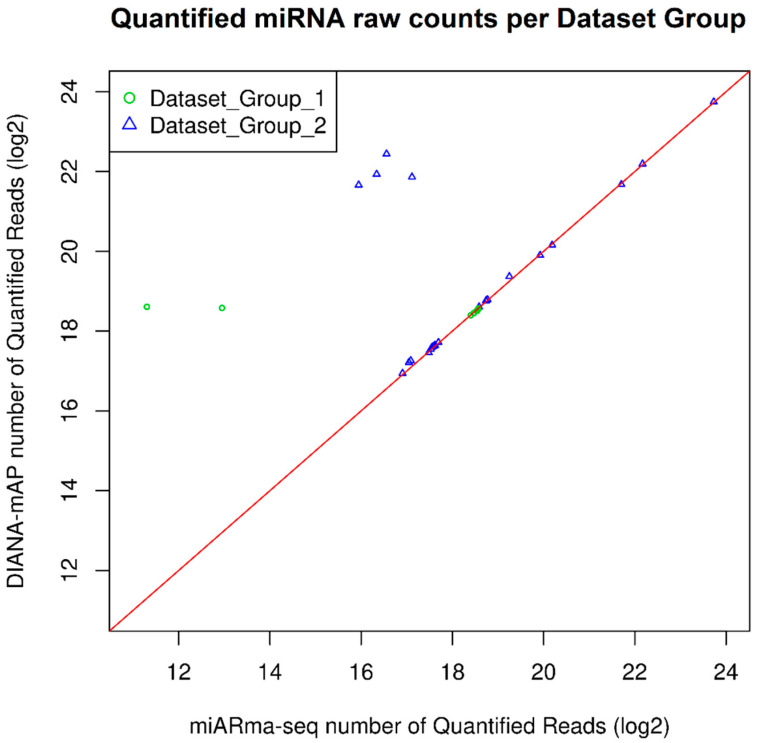
Figure 4.
Scatter plot of the quantified miRNA raw counts (Log2-transformed) produced by DIANA-mAP and miARma-Seq tools by analyzing: Dataset_Group_1: 8 publicly available datasets analyzed in the publication of miARma-Seq, also offered as example datasets alongside the tool; Dataset_Group_2: 24 publicly available datasets acquired from SRA and analyzed as examples for this study. Each marker represents the number of quantified miRNA raw counts produced by the two tools for a sample. Markers on top of the red line indicate equal numbers of quantified reads between the tools for that sample. Markers skewing toward a particular side indicates a higher number produced for that side.

