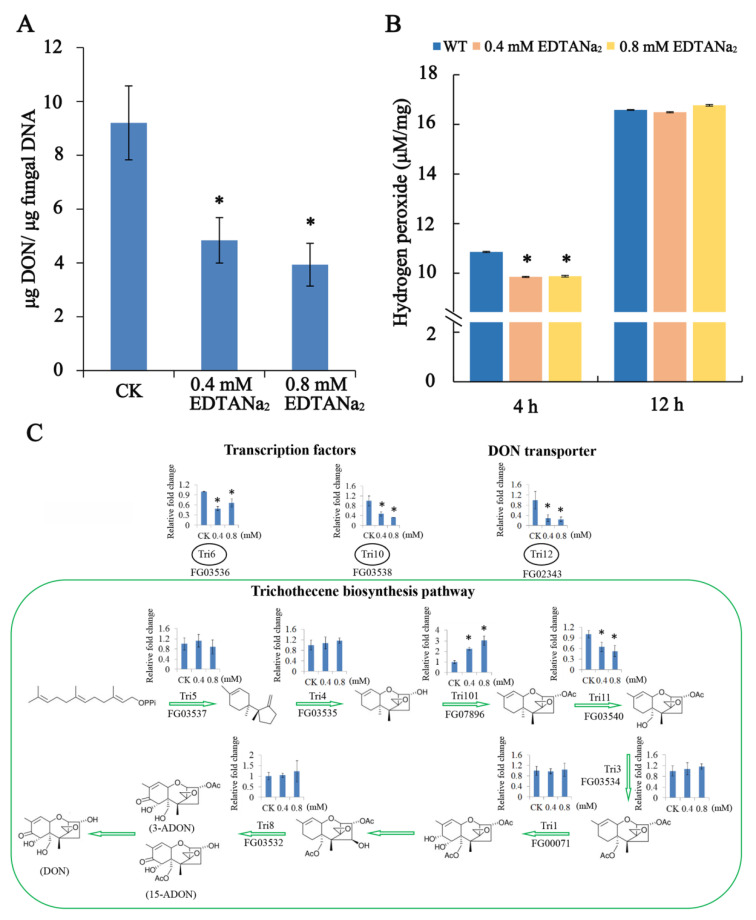
Figure 3.
Effect of EDTANa2 on production of deoxynivalenol (DON) (A), H2O2 concentrations (B) and TRI genes expression (C). DON content was determined using a competitive ELISA approach 7 d after start of the experiments. The experiment was repeated three times. H2O2 was measured at 4 h and 12 h and calculated based on a standard curve included in each experiment. TRI gene expression was assayed by qRT-PCR. Hyphae were harvested from 2-day-old TBI cultures (1 day after EDTANa2 adding). Data are represented as the means ± SD of three biological replicates (significant differences at * p < 0.05).

