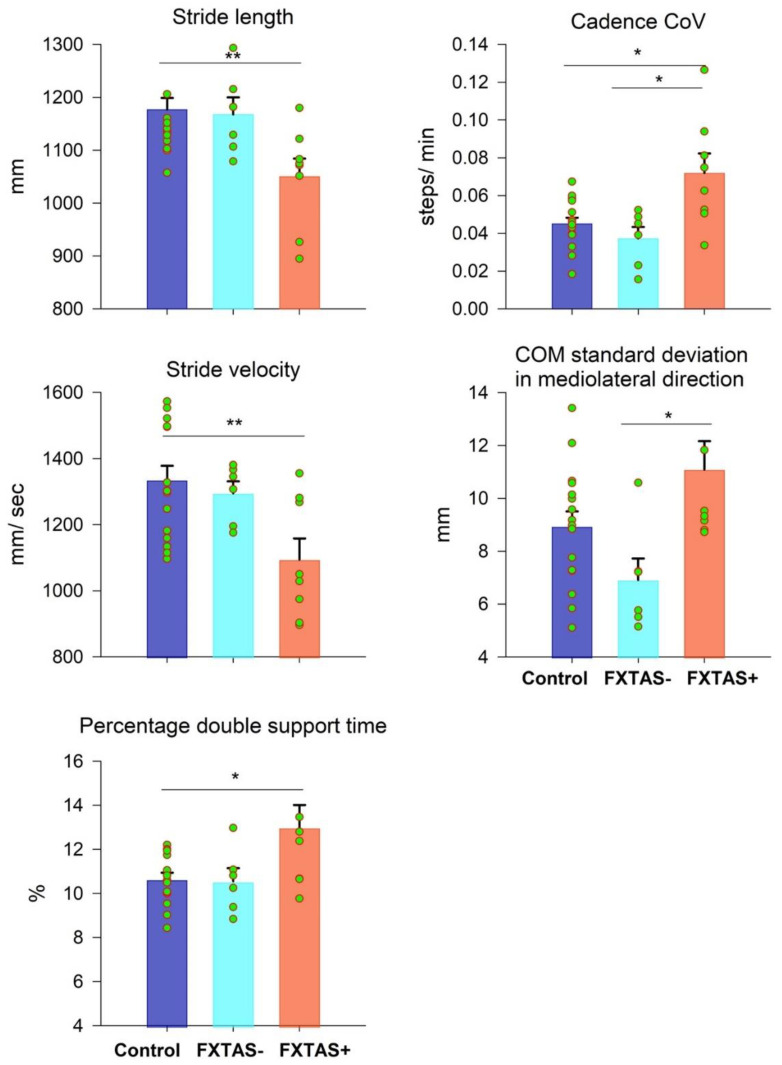
Figure 2.
Mean differences in stride length, stride velocity, percentage of double support time, cadence coefficient of variation (CoV), and center of mass (COM) standard deviation in the mediolateral direction between the control (blue), FXTAS− (cyan), and FXTAS+ (orange) groups. Error bars represent standard errors. * p < 0.02. ** p < 0.01.

