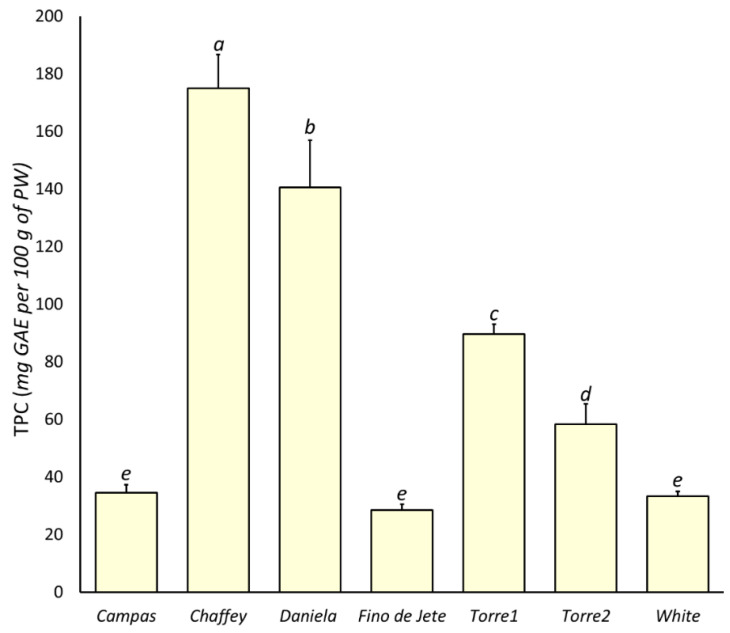
Figure 2.
The total polyphenolic content (TPC) in the flesh of the nine observed CVs of Annona cherimola fruits measured via Folin-Ciocolteau assay. The bars represent mean ± SD. Different lowercase letters on the top of bars indicate significant differences at p ≤ 0.05 as measured by one-way ANOVA followed by Tukey’s multiple range test. The letter “a” denotes the highest value.

