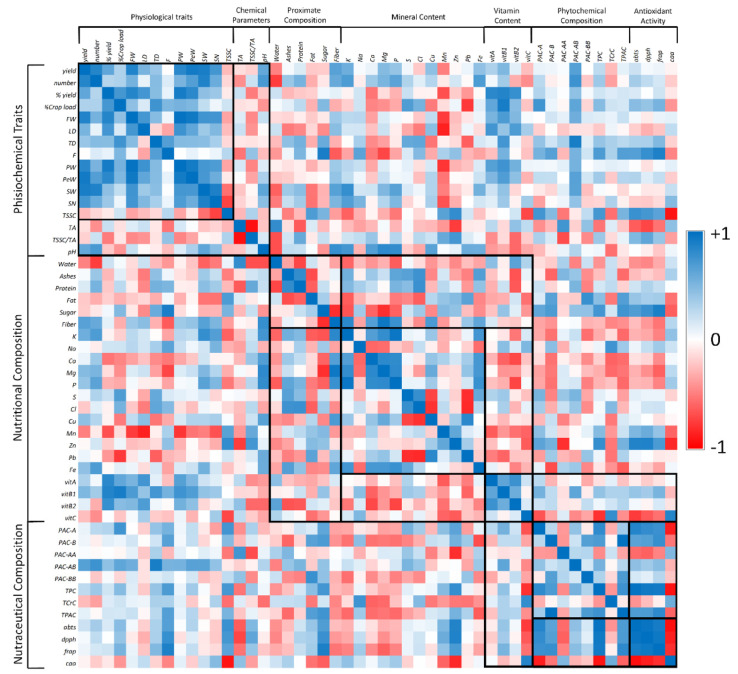
Figure 4.
A Pearson’s correlation heat map displaying the correlation coefficient (ρ) based on physiochemical, nutritional, and nutraceutical data of the seven observed cultivars of Annona cherimola fruits. Different colors represent the negative (red) to positive (blue) correlation between two different parameters.

