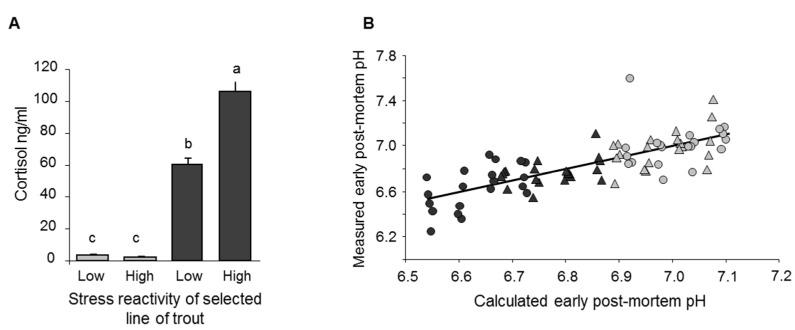
Figure 6.
(A) Plasma cortisol levels of trout just before slaughter (bars where letters (a–c) differ have significantly different values (p < 0.0001)) and (B) relationship between calculated and measured pH just after slaughter: pH = 6.8 − 0.003 × slaughter order +0.1 × high reactivity +0.4 × No additional stress at slaughter −0.2 × high reactivity × No additional stress at slaughter. The equation explains 53.3% of the variability between individuals. Dark bars (A) and dark symbols (B) indicate slaughter following additional stress (15 min waiting in a tank with 20 cm depth of water). Triangles and circles indicate selection lines with high and low stress reactivity, respectively. Adapted from [61,81], with permission from INRAE, 2020 and Elsevier, 2020.

