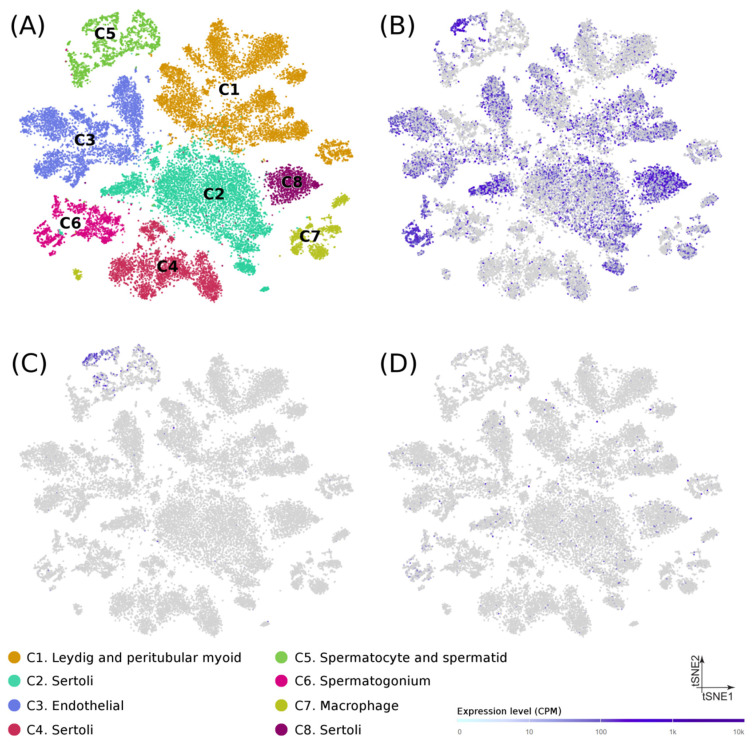
Figure 2.
Gene expression in testicular cells from human adolescence subjects. (A) Dimension reduction (t-SNE) plots of single-cell transcriptome data in puberty human testes (n = 31,671) based on RNA-seq dataset from Guo et al. (Guo et al. 2020). Single cells are represented as colored dots and the different colors indicate cluster identities. Specific expression patterns of USP8 (B), UPS50 (C), and AP4A1 (D) projected on the t-SNE plot are shown. Tonality of blue correlates with expression (with gray indicating low or no expression).

