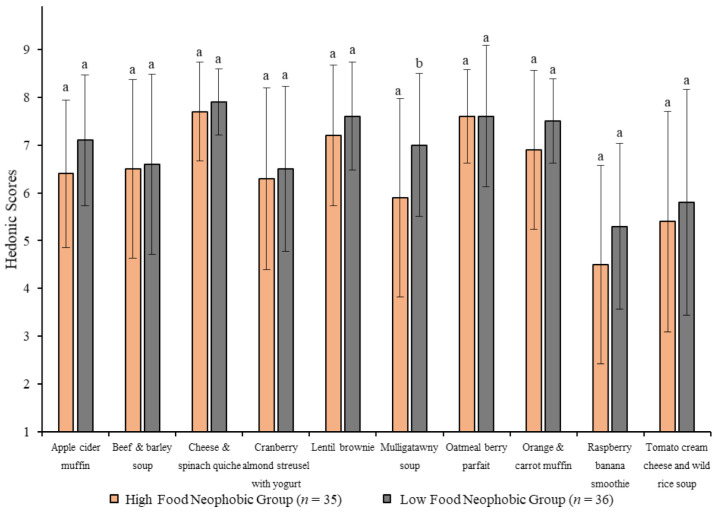
Figure 3.
Means and standard deviations for overall liking of ten nutrient-dense foods between food neophobia subgroups without health and nutrition information. Y-axis represents the 9-point hedonic scale (1 = dislike extremely, 5 = neither like nor dislike, 9 = like extremely). For each food, values with different letters are significantly different (p < 0.05). n = 34 for cheese and spinach quiche and tomato cream cheese and wild rice soup in high food neophobia group due to missing data.

