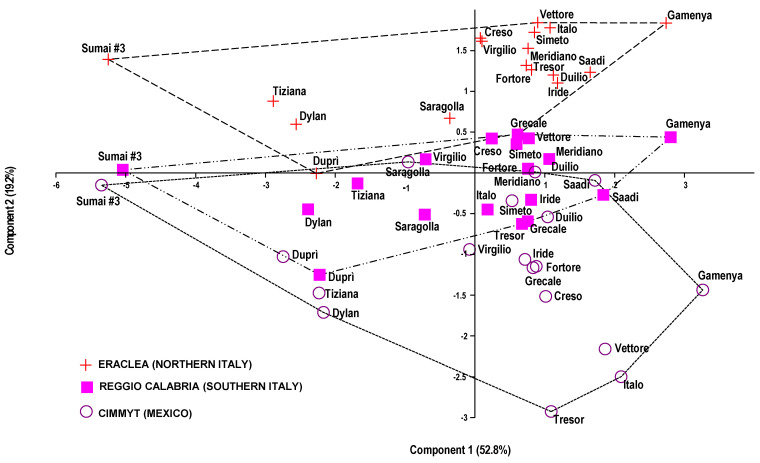
Figure 1.
Scatter diagram resulting from principal component analysis (PCA), as defined by the first two principal components. Cultivars are clustered on the basis of similarity of disease susceptibility indices, phenological traits and qualitative grain features. They are grouped by site: Eraclea, Reggio Calabria (RC) and CIMMYT. Groups are delimited by convex hulls to highlight their respective trends.

