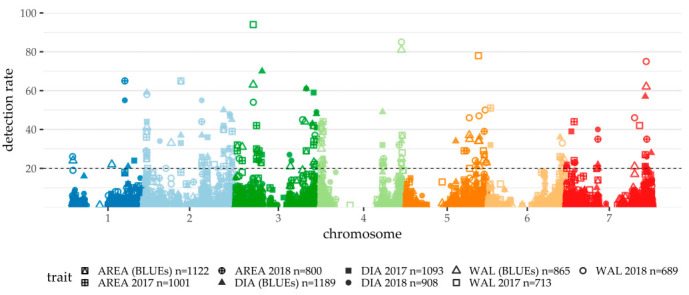
Figure 3.

Manhattan plot summarizing cross-validated genome-wide association study (GWAS) results of peduncle morphology traits 2017 and 2018. The physical SNP positions were taken from [18]. The different point shapes and fillings differentiate the traits and years. The detection rate (DR) in 100 cross-validation runs is given on the y-axis. The dashed line indicates the threshold of DR > 20, which was used as significance threshold. Markers without any detections are not displayed in the plot.
