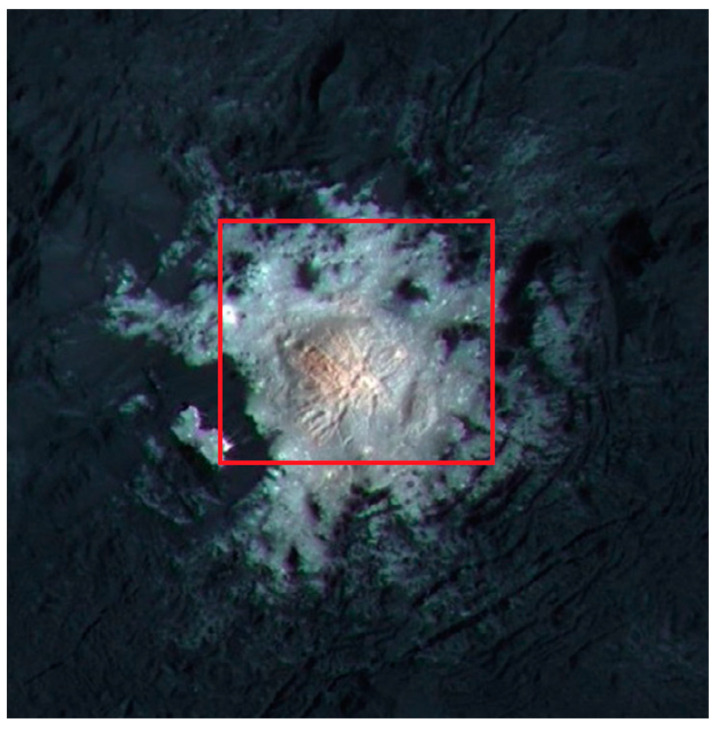
Figure 8.
Image of Cerealia Facula obtained by combining framing camera images acquired during LAMO phase with three images using spectral filters centered at 438, 550, and 965 nm. VIR pixel footprints inside the red rectangle (lat: 19.25° N–20.0° N, lon: 239.25° E–240° E) were averaged to obtain the reflectance spectrum [39].

