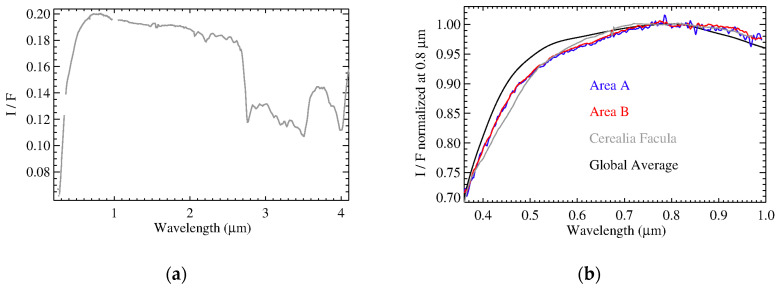
Figure 9.
Panel (a): Cerealia Facula average I/F spectrum’s VIS and IR channels (gray) were merged to obtain a single spectrum. Spectral range longward of 4.1 µm (not shown here) is affected by a high noise level after the subtraction of the thermal emission. Panel (b): focus on the visible spectral range; the spectrum of Cerealia Facula, the global Ceres spectrum, and the organic rich regions (Area A and B) were normalized at 0.8 µm.

