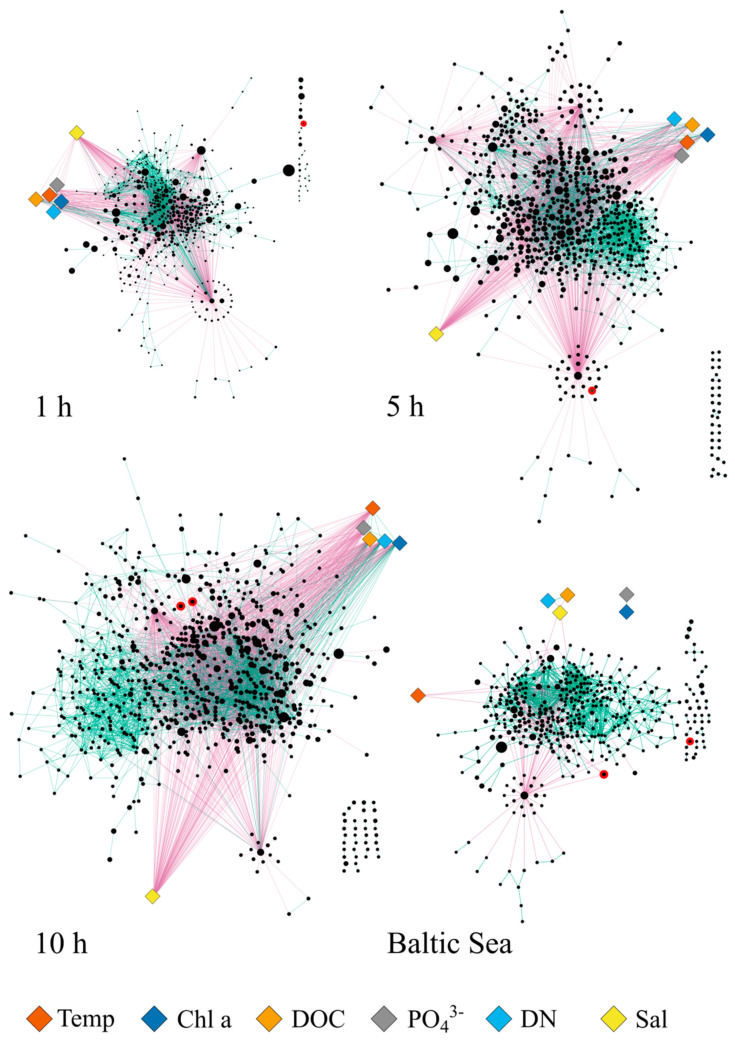
Figure 5.
Co-occurrence networks of bacterial OTUs (circles), with relative abundance > 0.01% in at least three samples on plastics. Circle size represents mean abundance across all samples. Co-presence between OTUs is depicted with green edges, mutual exclusions with magenta edges. Co-occurrence networks for the exposure experiment include all stations but separated for the three different timepoints (1, 5, and 10 h), including environmental parameters (diamond shape: Temp = temperature, Chl a = chlorophyll a, DOC = dissolved organic carbon, PO43− = phosphate, DN = dissolved nitrogen, Sal = salinity). A co-occurrence network for field-collected microplastics was constructed for all stations within the Gulf of Finland. Vibrio OTUs are highlighted with a red contour.

