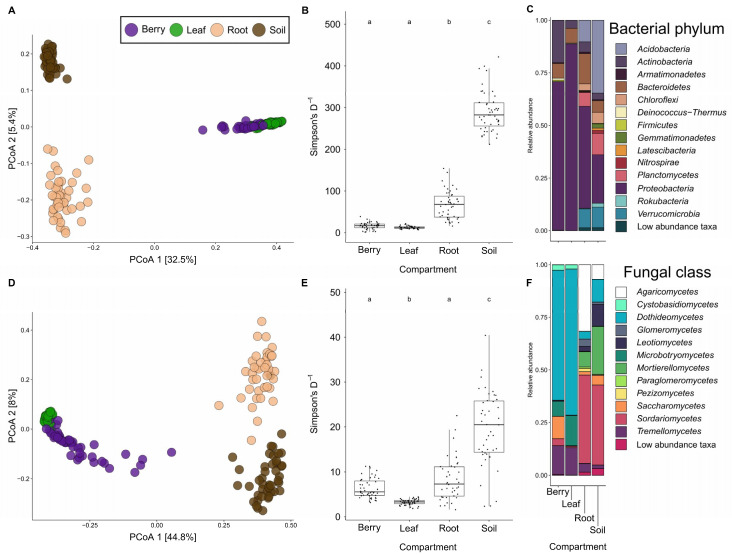
Figure 2.
Principal coordinates analysis illustrates strong clustering of samples by compartment for (A) bacterial (unweighted UniFrac: PERMANOVA F3176 = 40.7, p < 0.001) and (D) fungal (Bray–Curtis: PERMANOVA F3176 = 74.3, p < 0.001). Inverse Simpson’s Diversity index of microorganism compartments for (B) bacteria and (E) fungal samples show a relative increase in diversity from above-ground to below-ground compartments. Taxonomic barplots for (C) bacterial phyla and (F) fungal classes reveals differences in microorganism community composition and structure by compartment.

