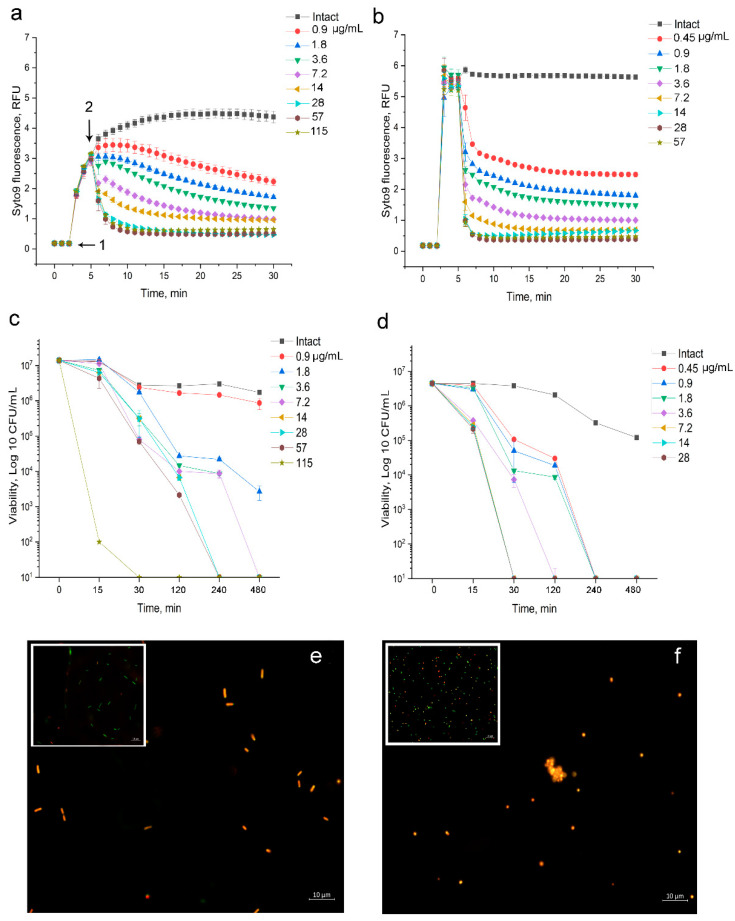
Figure 2.
Dynamic of Syto 9 fluorescence measured for 30 min. (a) E. coli K12 treated with 2,4-DAPG; (b) S. aureus 209P treated with 2,4-DAPG. Designations: 1—the moment of introduction of the fluorophore; 2—the moment of introduction of 2,4-DAPG;.Time-kill curves of 2,4-DAPG action on E. coli K12 (c) and S. aureus 209 P (d) obtained by the agar-drop plate assay. The line plots demonstrated dynamic of bacterial survival as a dependence of 2,4-DAPG concentration and exposure time. Y-axis is a number of viable bacterial cells (Log 10 CFU/mL), while X-axis is time of treatment (minutes); Epifluorescence images of E. coli K12 cells (e) and S. aureus 209P (f) treated with 2,4-DAPG. The inset parts of the images showed untreated bacterial populations.

