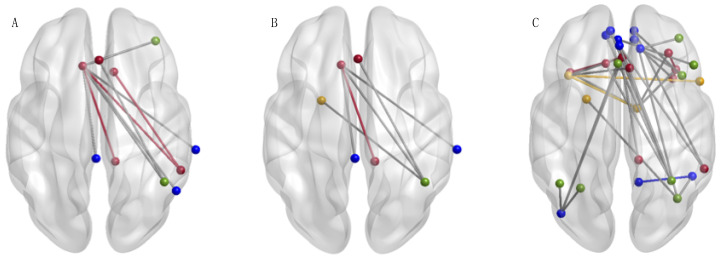
Figure 2.
The Network-Based Statistic (NBS) [24] identified resting state functional connectivity effects of Acceptance and Commitment Therapy (ACT) between DMN (blue), FPN (green), SN (red), and the pain network (yellow). This shows decreased functional connectivity (post-ACT > pre-ACT) for (A) 10 nodes connected by 10 edges (t > 2.5; p = 0.05, 10,000 permutations), (B) 7 nodes connected by 6 edges (t > 2.5; p = 0.004, 10,000 permutations), and (C) 31 nodes connected by 34 edges (t > 3.4; p = 0.036, 10,000 permutations). Within network connectivity changes were represented by functional connections of color (a connection within SN nodes (red) will be represented by a red edge, etc.). See Supplementary Materials (Table S3) for details of which nodes of each network were included in these significant networks. Figures were created using BrainNet [38].

