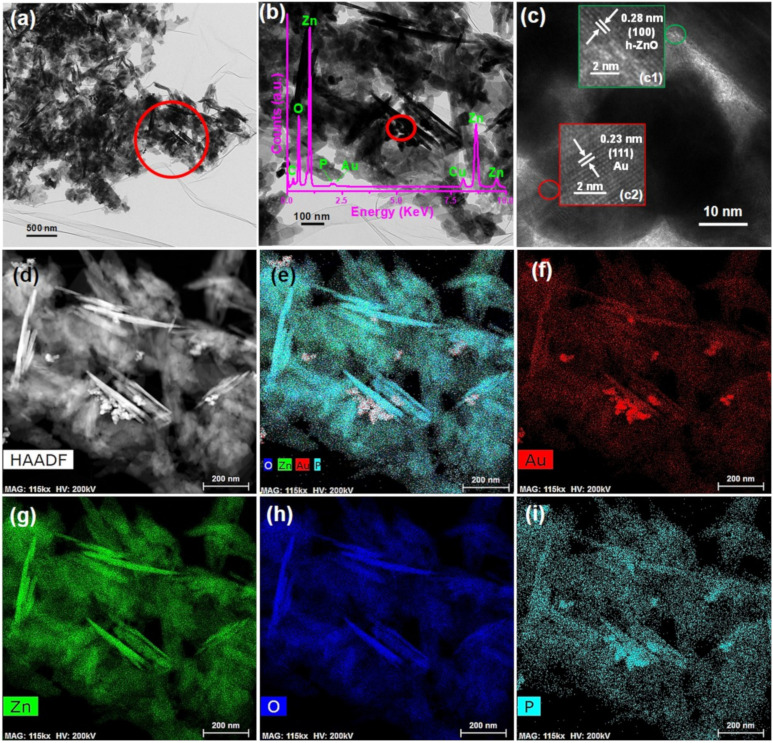
Figure 2.
Characterization of the AZB sample. (a) TEM image of the AZB sample. (b) Enlarged TEM image of the marked region in the panel of (a). Inset displays the energy-dispersive X-ray spectrum of the AZB sample. (c) HRTEM image of the marked region in the panel of (b). Insets (c1) and (c2) display the HRTEM images of ZO and Au NPs, respectively. (d) High-angle annular dark-field (HAADF) image of the AZB sample and elemental maps of (e) the AZB composite, (f) Au, (g) Zn, (h) oxygen (O), and (i) phosphorus (P).

