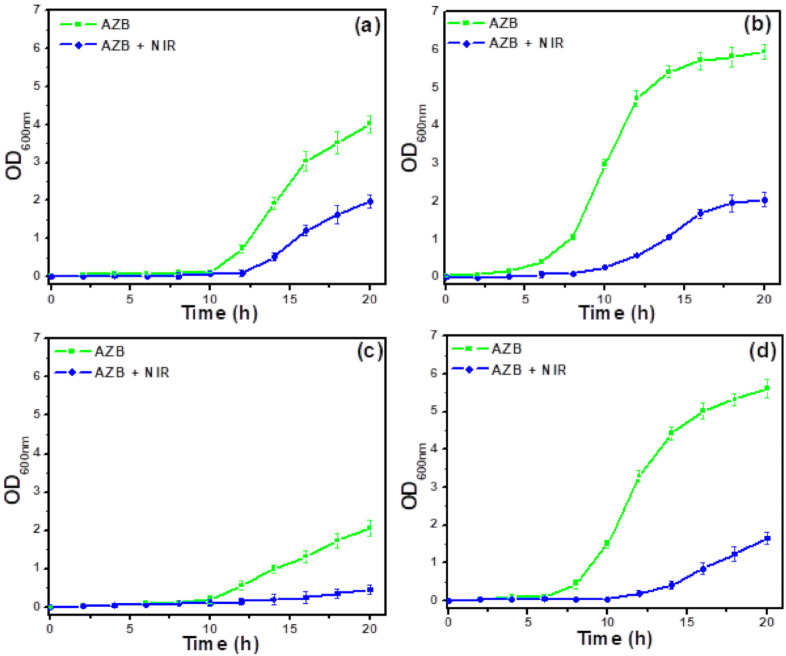
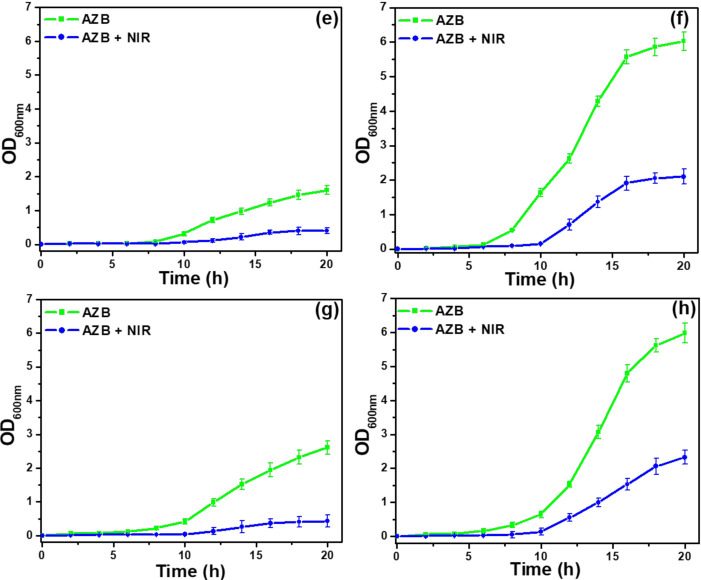
Figure 6.
Effect of NIR on antibacterial activity of AZB. Growth curves of (a) MRSA1, (b) MRSA2, (c) MRSA3, (d) MRSA4, (e) MRSA5, (f) MRSA6, (g) MRSA7, and (h) MRSA8 cells subjected to the AZB and AZB + NIR treatments. The concentration of each AZB nanomaterial was 50 μg mL−1 (the data are shown as the mean of triplicates).


