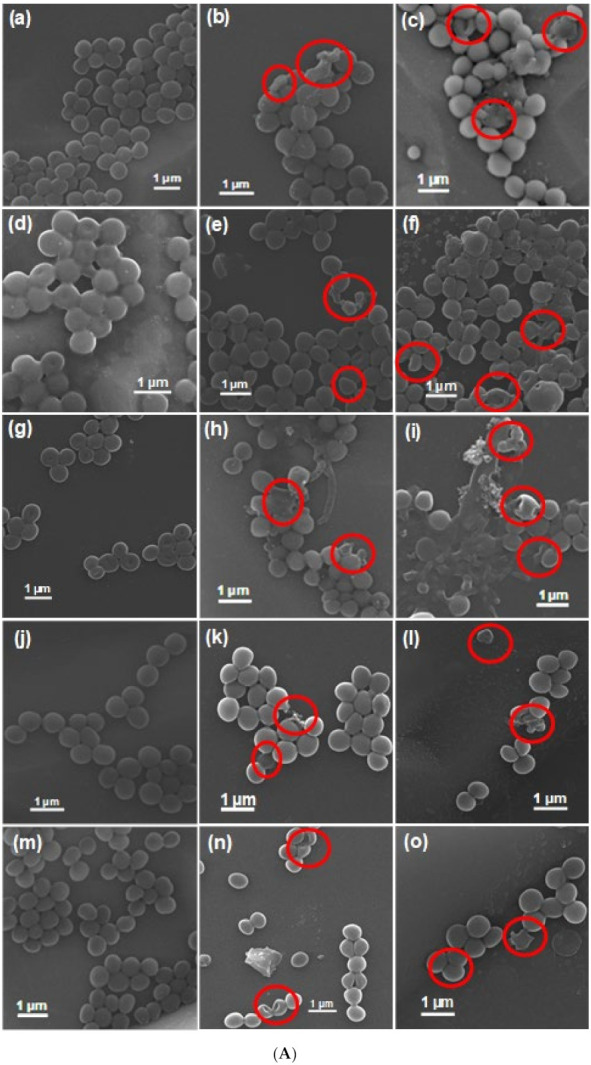
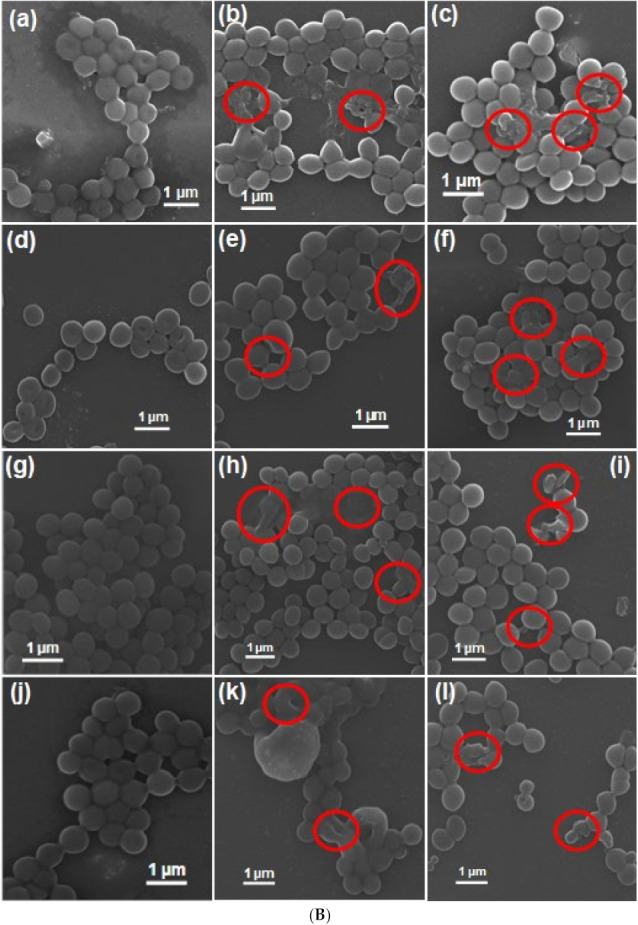
Figure 7.


SEM images of bacterial cells after various treatments. (A) Untreated (a) S. aureus, (d) MRSA1, (g) MRSA2, (j) MRSA3, and (m) MRSA4. AZB-treated (b) S. aureus, (e) MRSA1, (h) MRSA2, (k) MRSA3, and (n) MRSA4. AZB + NIR-treated (c) S. aureus, (f) MRSA1, (i) MRSA2, (l) MRSA3, and (o) MRSA4. (B) Untreated (a) MRSA5, (d) MRSA6, (g) MRSA7, and (j) MRSA8. AZB-treated (b) MRSA5, (e) MRSA6, (h) MRSA7, and (k) MRSA8. AZB + NIR-treated (c) MRSA5, (f) MRSA6, (i) MRSA7, and (l) MRSA8. Disrupted cell membrane regions by treatments are indicated by the red circles.
