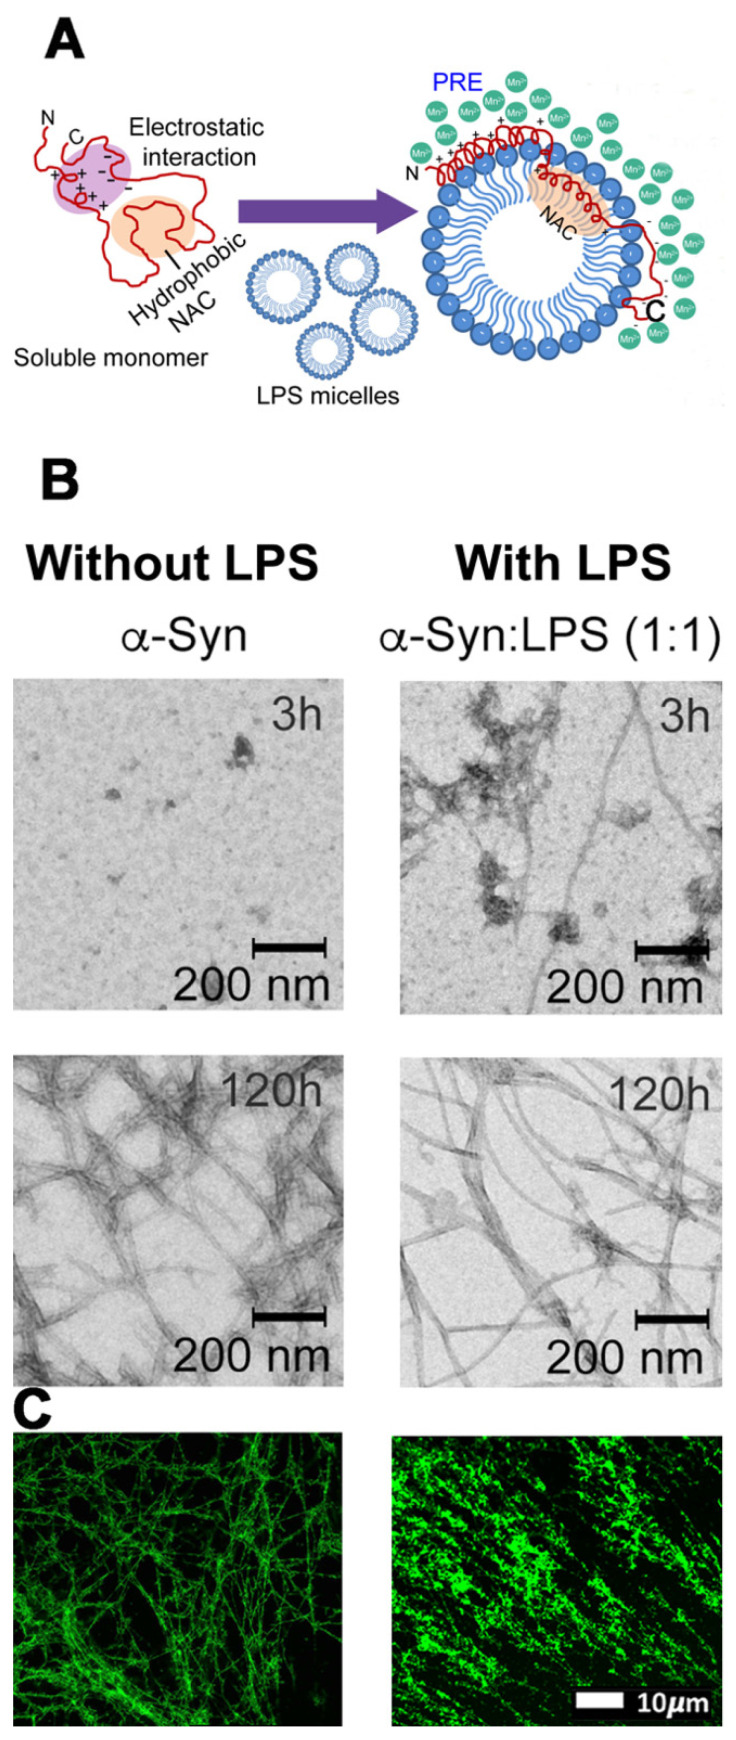
Figure 4.
Courtesy of [23] (permission and license of usage were granted by publisher and supported by authors).(A) Schematic representation of the orientation of α-Syn in aqueous solution (left) and in the presence of lipopolysaccharides (LPS) micelle (right). Paramagnetic relaxation enhancement (PRE), using MnCl2 as quenching agent, herein indicated only as “Mn”, was used by the authors to verify internalization of the N-terminal- and NAC regions of α-Syn into the LPS micelle. (B) Transmission electron microscopy (TEM) images showing morphologically distinct α-Syn fibrils at 1:1 LPS concentration at two different time points (t = 3 and 120 h). Scale = 200 nm. (C) Confocal microscopy images of fibrin networks formed from purified fibrinogen (with added Alexa 488 fluorophore) incubated with and without LPS from P. gingivalis, followed by addition of thrombin to create extensive fibrin(ogen) clots (unused raw data from [45].

