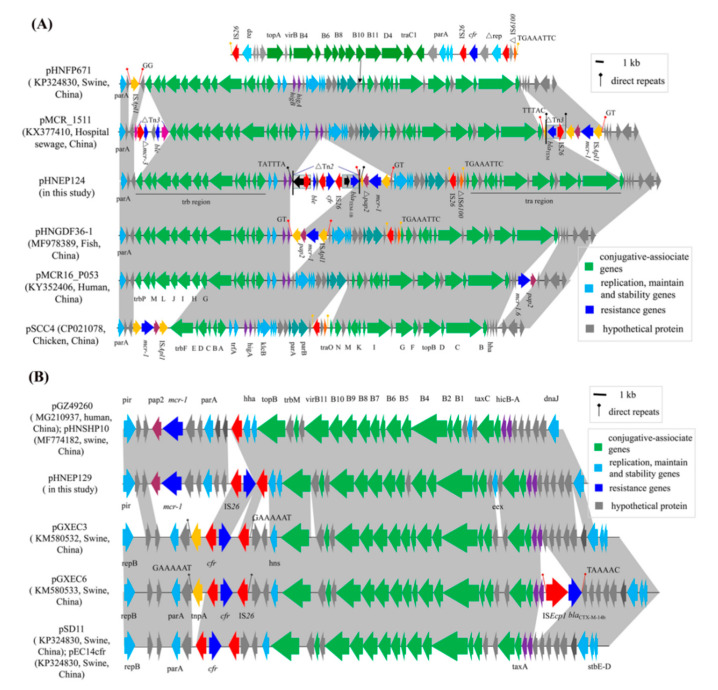
Figure 3.
Liner comparison of the cfr-carrying plasmids. Arrows indicate the positions of the genes and the direction. Regions with >99% homology are shaded in gray. ∆ indicates a truncated gene or mobile element. (A) Comparative analysis of plasmid pHNEP124 and other IncP-type plasmids. (B) Comparative analysis of plasmid pHNEP129 and other IncX4-type plasmids.

