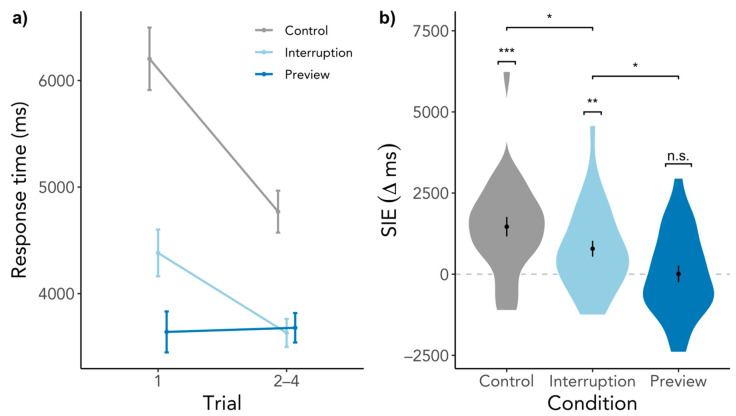
Figure 5.
SIE in response times only for trials in which the target object has been fixated previously. (a) depicts the response times for the first trial in a scene visit and the average of the response times of the second to the fourth trial. (b) shows the difference between the response time of the first trial and the average of the second to the fourth trial. Higher values indicate a larger response time for the first trial than the subsequent trials, while the dashed line indicates the point of no difference in response times between trials. Error bars indicate within-subject standard error. n.s. = not significant, * p < 0.05., ** p < 0.01, *** p < 0.001.

