Figure 2.
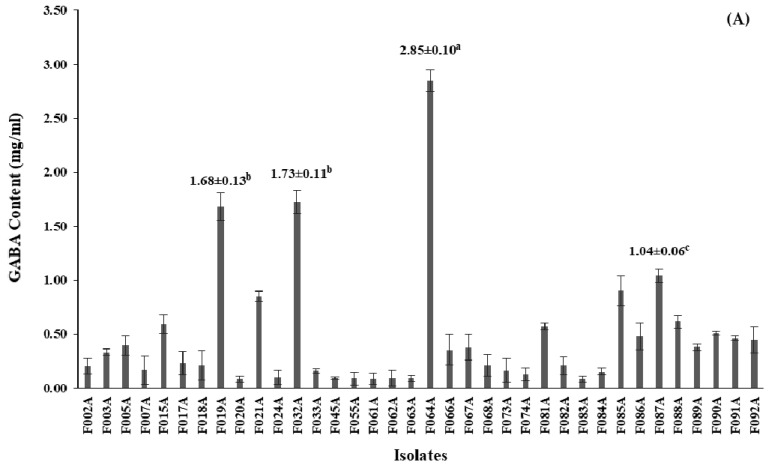
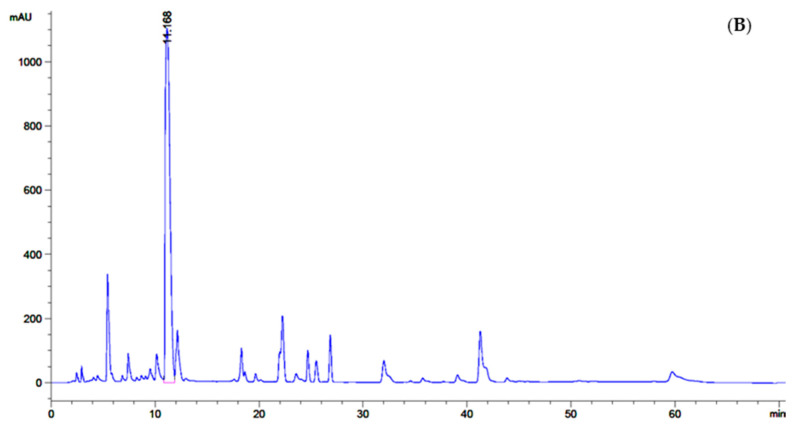
Screening of GABA-producing LAB; (A) GABA content (mg/mL) from 36 isolates after 24 h of cultivation in De Man, Rogosa and Sharpe (MRS-MSG) broth. The bars represented mean ± standard deviation (S.D., n = 2); (B) chromatogram showed peak area (mAU) of GABA content (retention time at 11.168) detected by high-performance liquid chromatography (HPLC) after being derivatized with phenylisothiocyanate (PITC) solution. The statistical analysis was performed by using one-way analysis of variance (ANOVA) Values with different superscript letter in Figure 2A are considered statistically significant difference at p < 0.05.


