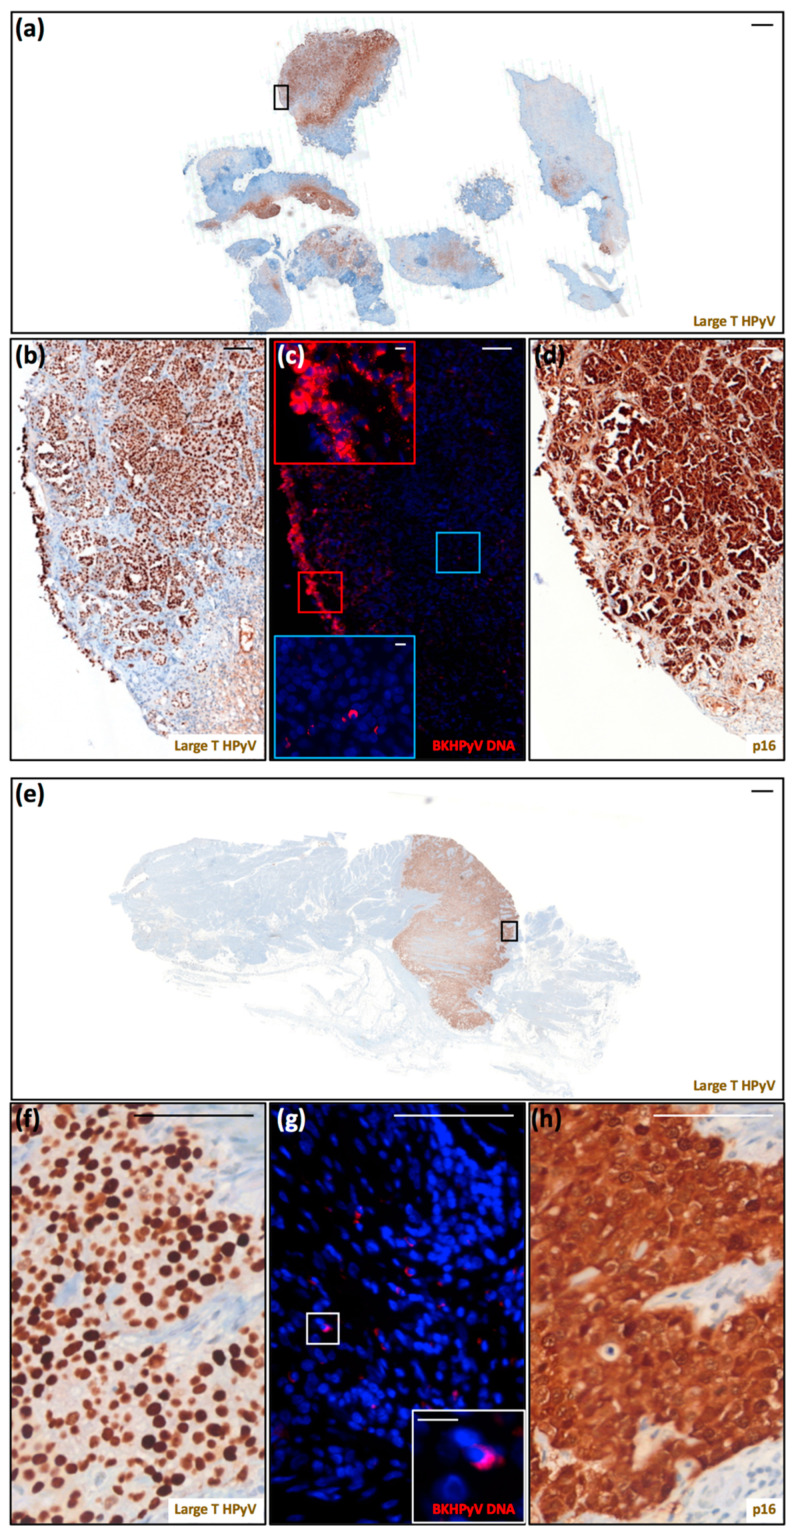
Figure 3.
Detection of polyomavirus large-T antigen, BKPyV DNA, and cellular p16INK4a in two urinary bladder carcinomas. (a) Scan of a tissue section of the urinary bladder carcinoma from patient 13 labeled for LT (scale bar: 1000 μm). (b–d) These panels correspond to the black square highlighted in (a). (b) Magnification of LT labeling (scale bar: 100 μm). (d) Scan of a serial section labeled for p16INK4a (scale bar: 100 μm). These sections were counterstained with hematoxylin to visualize cell nuclei. (c) Serial section stained for BKPyV genome by FISH (red) (scale bar: 100 μm). The regions shown in the insets correspond to the red (superficial) and blue (internal) squares (scale bar: 10 μm). This section was counterstained with 4′,6-diamidino-2-phenylindole (DAPI) (blue) to visualize cell nuclei. (e) Scan of a tissue section of the urinary bladder carcinoma from patient 15 stained for LT (scale bar: 1000 μm). (f–h) These panels correspond to the black square highlighted in (e). (f) Magnification of LT labeling (scale bar: 100 μm). (h) Scan of a serial section stained for p16INK4a (scale bar: 100 μm). These sections were counterstained with hematoxylin to visualize cell nuclei. (g) Serial section stained for BKPyV genome by FISH (red) (scale bar: 100 μm). The regions shown in the insets correspond to the white square (scale bar: 10 μm). This section was counterstained with 4′,6-diamidino-2-phenylindole (DAPI) (blue) to visualize cell nuclei.

