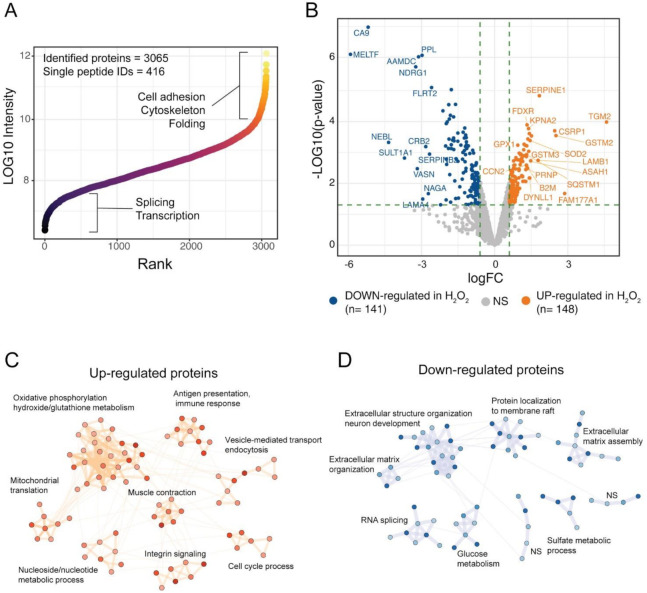
Figure 2.
Proteomic analysis of H2O2-treated ARPE cells. (A) the scatter plot reports the identified proteins ranked according to intensity values, ~3000 protein groups were identified in ARPE-19 cells, across six orders of magnitude; (B) Volcano plot of the differentially expressed proteins upon H2O2 treatment. A total of 148 proteins were up-regulated by H2O2 treatment, while 141 showed down-regulation as compared to control samples; (C,D) Network analysis of DE proteins after H2O2 treatment. Networks were retrieved using the STRING database and visualised using the Cytoscape software. Functional enrichment was used to understand which biological processes were enriched in each cluster.

