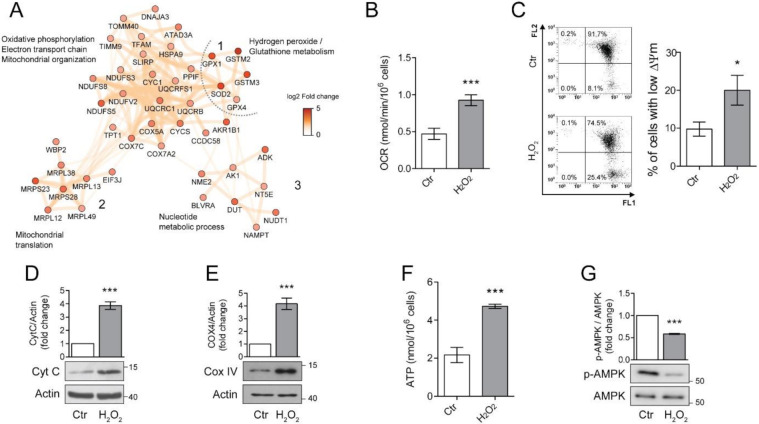
Figure 3.
Chronic sublethal oxidative insult induces mitochondrial alterations in ARPE-19 cells. (A) Network of up-regulated protein clusters involved in mitochondrial and energy-related processes. Cluster 1 was linked to oxidative phosphorylation, electron transport and mitochondrial organization, cluster 2 included several proteins involved in mitochondrial translation, while cluster 3 was composed of proteins involved in nucleotide metabolism. Color is related to the log2-fold change difference in expression between H2O2 and Ctr. Ctr and H2O2 treated cells were seeded in H2O2-free medium, grown for 72 h and used for the experiments; (B) Oxygen concentration was recorder in 1 mL of respiration buffer containing 200 nmol oxygen/mL at 37 °C. Data are expressed as nmol/min/106 cells and are the mean ± SD of four independent experiments; (C) Cells loaded with 1.5 µM JC-1 for 30 min and analysed by flow cytometry. Representative dots (upper panel) represent a single cell analysed for its green (FL1) and orange (FL2) associated fluorescence. Number in each quarter indicate the cell population percent. In the histogram, data represent the mean ± SD of three independent experiments; (D,E) Western blotting analysis of Cytochrome C (Cyt C) and Cytochrome oxidase IV (COXIV), respectively. β-actin was used as loading control. Bar graphs represent the densitometric analysis reported as the ratio between protein and β-actin band intensity. Untreated cells were used as control and assumed as 1. One representative blot is shown and densitometric analyses are expressed as the mean ± SD of three independent experiments; (F) Total cellular ATP levels measured by ATP luminescence-based assay and reported as nmol/106 cells; (G) Western Blotting of phosphorylated and total AMPK. Bar graphs represent the densitometric analysis reported as the ratio between phosphorylated and unphosphorylated AMPK band intensity. Untreated cells were used as control and assumed as 1. One representative blot is shown and densitometric analyses are expressed as the mean ± SD of three independent experiments (* p < 0.05, *** p < 0.001).

