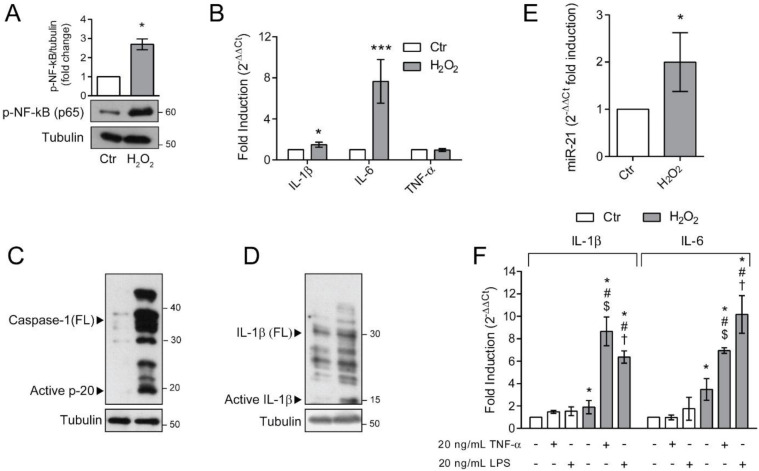
Figure 5.
Senescent ARPE-19 cells show an inflammatory phenotype. Ctr and H2O2 treated cells were seeded in H2O2-free medium and grown for 72 h and used for experiments (A) Western Blotting of phosphorylated NF-κB p65. α-tubulin was used as loading control. Bar graphs represent the densitometric analysis reported as the ratio between protein and α-tubulin band intensity. Untreated cells were used as control and assumed as 1. One representative blot is shown and densitometric analyses are expressed as the mean ± SD of three independent experiments; (B) gene expression of IL-1β, IL-6 and TNF-α assessed by qPCR. Gene expression values were normalized to GAPDH and presented as 2−ΔΔCt. Relative mRNA gene abundance in untreated cells was assumed as 1 (control). Data represent the mean ± SD from n = 5 independent experiments performed in triplicate. (* p < 0.05, *** p < 0.001); (C,D) Western Blot analysis of Caspase-1 and IL-1β full length (FL) and cleaved active fragments. α-tubulin was used as loading control. Bar graphs represent the densitometric analysis reported as the ratio between protein and α-tubulin band intensity. Untreated cells were used as control and assumed as 1. One representative blot is shown and densitometric analyses are expressed as the mean ± SD of three independent experiments; (E) Expression of miR-21 by qPCR. Gene expression values were normalized to U6snRNA and presented as 2−ΔΔCt. Relative mRNA gene abundance in untreated cells was assumed as 1 (control). Data represent the mean ± SD of three independent experiments; (F) Ctr and H2O2-treated cells were exposed to 10 μg/mL LPS or 20 nM TNFα for 6 h before harvesting. Gene expression of IL-1β and IL-6 was assessed by qPCR. Gene expression values were normalized to GAPDH and presented as 2−ΔΔCt. Relative mRNA gene abundance in untreated cells was set to 1 (control). Data represent the mean ± SD from n = 3 independent experiments performed in triplicate. (* at least p < 0.05 vs. Ctr non-treated (--); # p < 0.05 vs. H2O2 non-treated (--); $ p < 0.05 vs. Ctr TNFα + LPS-; † p < 0.05 vs. Ctr TNFα − LPS +).

