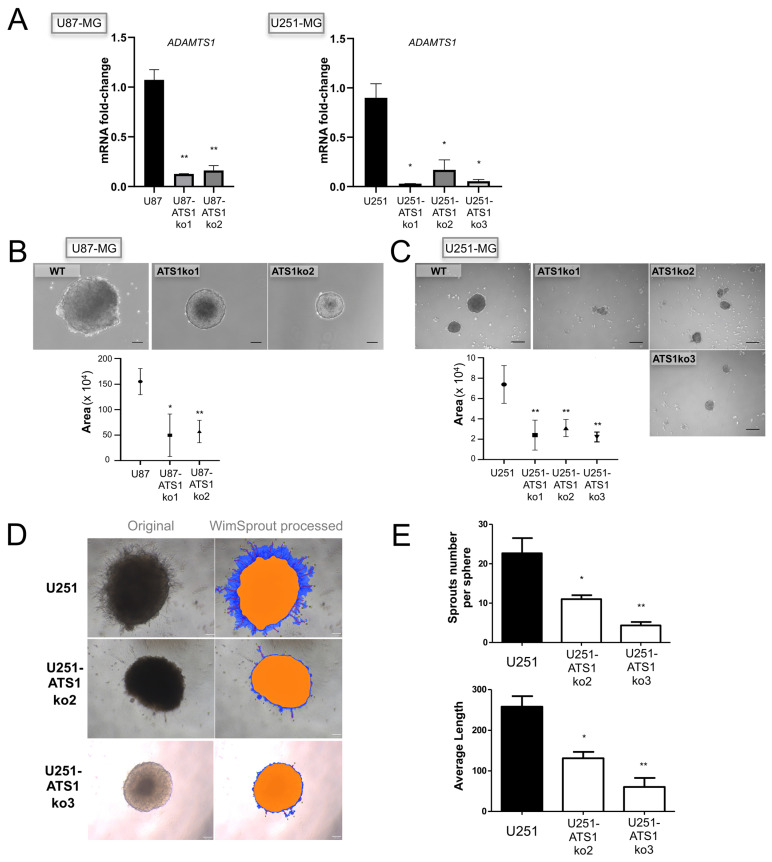
Figure 3.
Effect of ADAMTS1 knockout in GBM cells. (A) Graph representing mRNA fold change expression of ADAMTS1 in U87-MG, U251-MG, and their respective ATS1ko clones (n ≥ 3 for all cells) (**, p < 0.01; and *, p < 0.05. WT U87-MG and U251-MG cells were used as controls for statistical analyses, respectively); (B) Representative images of tumor-spheres derived from WT U87-MG and its ATS1ko clones, and graph representing their measures; (C) Representative images of tumor-spheres derived from WT U251-MG and its ATS1ko clones, and graph representing their measures; (D) Representative images (original and WimSprout processed) of 24 h sprouting tumor-spheres derived from WT U251-MG and U251-ATS1ko2 and ko3 clones; (E) graphs representing sprout number per sphere (top) and average length (bottom) according to WimSprout quantification of sprouting spheres as in (E) (n ≥ 3 samples for all cells) (**, p < 0.01; and *, p < 0.05).

