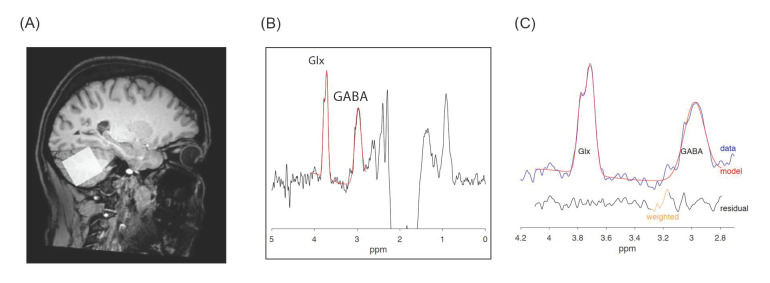
Figure 1.
Cerebellar GABA and Glx spectra. Legend: (A) Voxel placement in the right hemisphere; (B) acquired Magnetic Resonance Spectroscopy (MRS) spectra with gamma-aminobutyric acid (GABA) and Glutamate/Glutamine complex (Glx) peaks in red, and (C) zoom on GABA and Glx peaks: acquired data are in blue, fit in red and residual in black.

