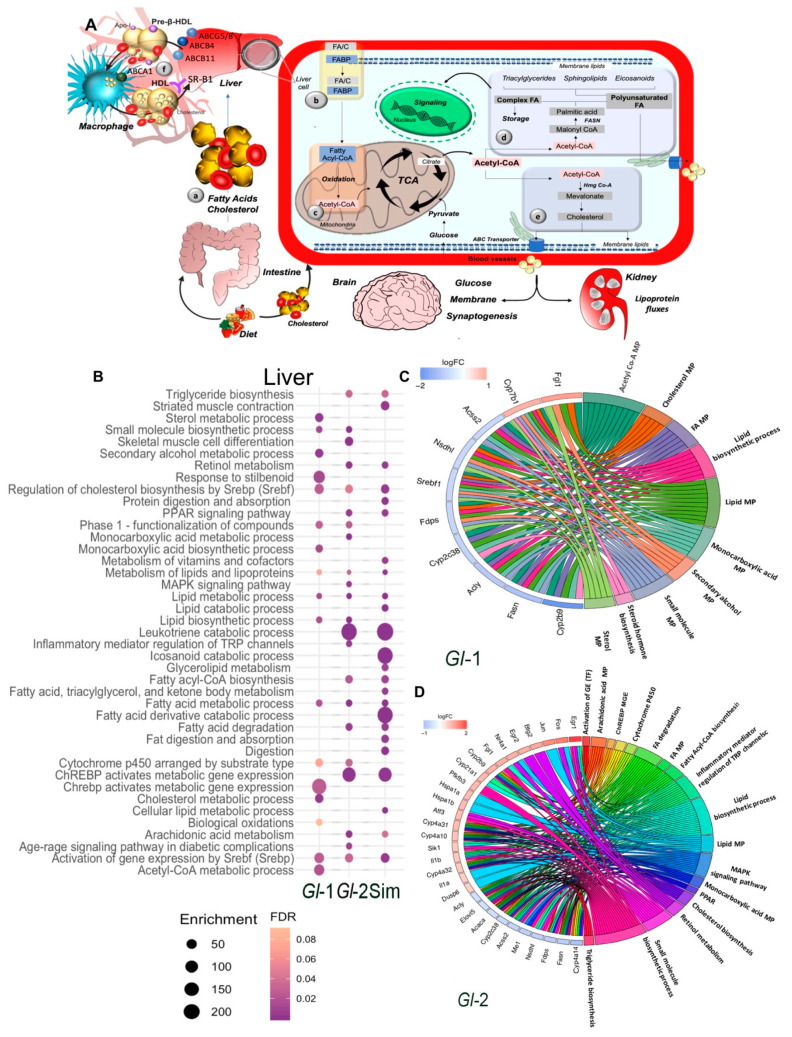
Figure 1.
Main pathways of lipid metabolism altered by a high-cholesterol diet (HCD) given to C57BL/6 mice, including the administration of standardized hydroalcoholic extracts (Gl-1, Gl-2) from a Mexican strain of Ganoderma lucidum, in comparison with the drug simvastatin. (A) Schematic overview of major pathways involved in lipid metabolism. (a) Fatty acids (FAs) from dietary ingestion are either internalized in the cell from blood circulation by fatty acid-binding proteins (FABPs), or synthesized de novo within cells (b). (c,d) De novo lipogenesis begins with the conversion of acetyl-CoA to malonyl-CoA. The multifunctional enzyme fatty acid synthase (FASN) is then coupled to acetyl-CoA and malonyl-CoA to generate palmitic acid, which is further elongated and desaturated to produce diverse saturated and unsaturated FAs (d). These FAs can then be converted to diverse types of lipids, such as diacylglycerides and triacylglycerides via the glycerol phosphate pathway, as well as sphingolipids, phosphoinositides and eicosanoids, which have important signaling functions in cells and tissues. Another class of lipids are sterols, mainly cholesterol (e). (f) Macrophage reverse cholesterol transport. Liver and intestine synthesize apolipoprotein A-I (Apo-I) that load cholesterol in free pre-β-HDL molecules from peripheral tissues via macrophages ABCA1 transporter. These HDL complex particles mature and transport its cholesterol directly to the liver via the hepatic scavenger receptor class B type 1 (SR-B1) receptor. At systemic level, major organs involved in lipid metabolism are liver, skeletal muscle, and adipose tissue, which express specific receptors and transport proteins for lipids uptake. However, other organs are also involved, such as brain and kidney, which contribute in lipoprotein fluxes and lipid metabolism. TCA: tricarboxylic acid cycle. C: cholesterol. (B) Pathway enrichment analysis, represented in a bubble plot, of hepatic differentially expressed genes in mice liver fed with a HCD, treated with Gl-1 or Gl-2 extracts, or simvastatin. Bubble size represents the enrichment score, while their color represents false discovery rate (FDR) values. Circos plots showing the relationship between selected terms and annotated genes as indicated by connecting lines at Gl-1 (C) and Gl-2 (D) interventions. Genes are located on the left side of the graph, and ordered on the basis of their logFC values. MP: metabolic process.

