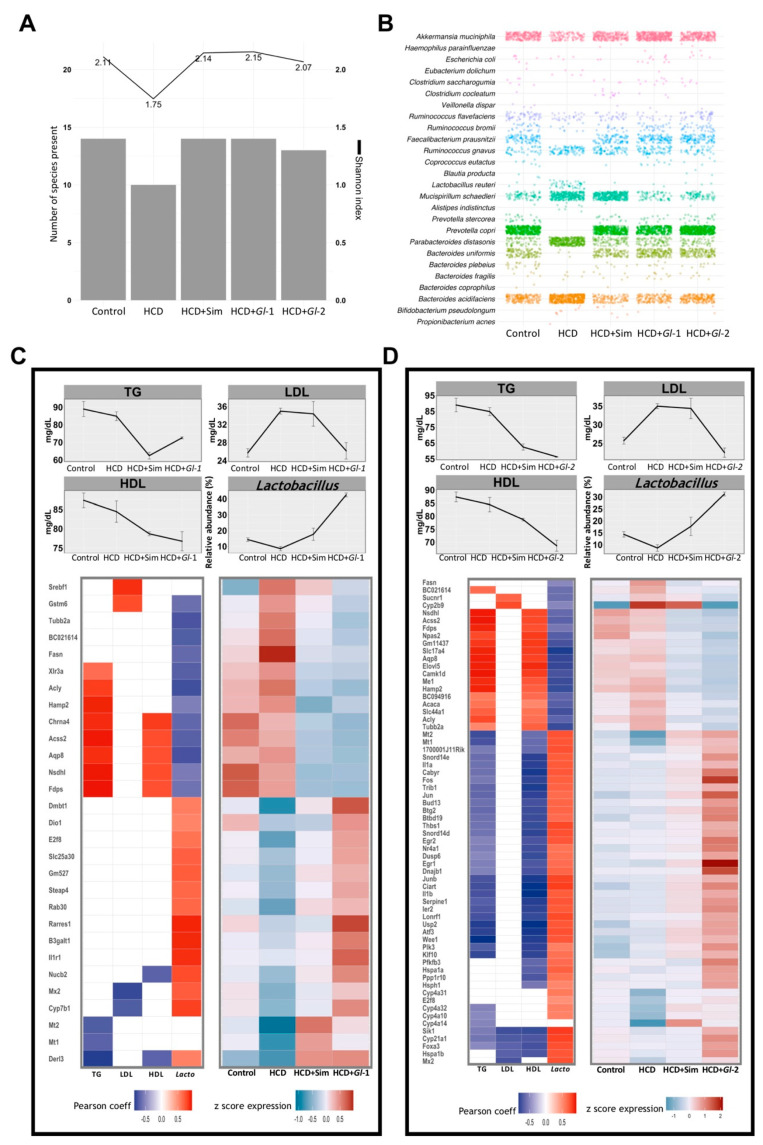
Figure 6.
Hepatic genes modulated by Ganoderma lucidum extracts (Gl-1, Gl-2) correlated with biochemical parameters and relative abundance of Lactobacillus in the gut microbiome. (A) Gut bacterial richness at species level according to the Shannon index (line plot) and the number of detected species (bar plot) in each experimental group. (B) Frequency grid plot showing relative abundance of bacterial species in the gut microbiota grouped by experimental condition. (C,D) Pearson correlation between expression levels of genes significantly modulated by Gl-1 or Gl-2 extracts (lower panel) and blood levels (mg/dL) of TG, LDL, HDL, and the relative abundance (%) of Lactobacillus in gut microbiome composition (upper panel). The left heatmap shows significant correlations (Pearson coefficient > 0.5, in red; <−0.5, in blue; FDR < 0.1) between Gl-1 (C) or Gl-2 (D) responsive genes and their variables at the top. The right heatmap in Gl-1 (C) or Gl-2 (D) represents expression levels of correlated genes in each experimental condition (low to high expression scale is indicated in blue and red, respectively). TG: triglycerides. HDL: high-density lipoprotein cholesterol. LDL: low-density lipoprotein cholesterol. HCD: high-cholesterol diet. HCD + Sim = high-cholesterol diet + simvastatin. HCD + Gl-1 = high-cholesterol diet + Gl-1 extract. HCD + Gl-2 = high-cholesterol diet + Gl-2 extract.

