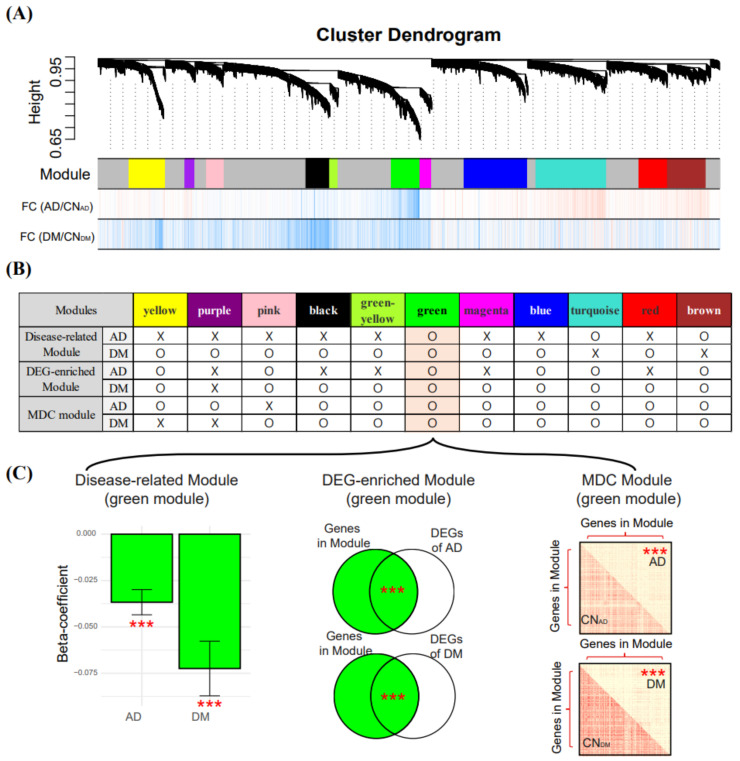
Figure 5.
Module construction using rWGCNA and selection of AD and DM co-related modules. (A) modules described by different colors were constructed using rWGCNA. FC values (logFC) between two conditions were determined using the limma package. Vertical bars with red and blue colors indicate genes with logFC > 0 and logFC < 0, respectively. (B) three criteria (described in the Section 2) were used to select modules. The “O” indicates that a module has a Bonferroni-corrected p-value < 0.05 for each criterion and denotes modules suitable for selection, and the “X” indicates that a module does not satisfy these criteria. (C) in the bar plot on the left, the y-axis indicates the beta-coefficient obtained from LMM, with eigengene and disease status as the dependent and independent variables, respectively. *** indicate the p-value (***, Bonferroni-corrected p-value < 0.001) from the LMM. In the middle Venn diagrams, the p-values between genes in the module and the DEGs were measured using Fisher’s exact test. In the matrix plots on the right, the red and yellow colors in squares indicate high or low biweight midcorrelation values, respectively. *** indicate a significant difference (t-test) between the intra-modular connectivity of the control and the case. rWGCNA, robust weighted gene co-expression network analysis; AD, Alzheimer’s disease; DM, diabetes mellitus; CNAD, AD-matched control; CNDM, DM-matched control; DEG, differentially expressed gene; and LMM, linear mixed model.

