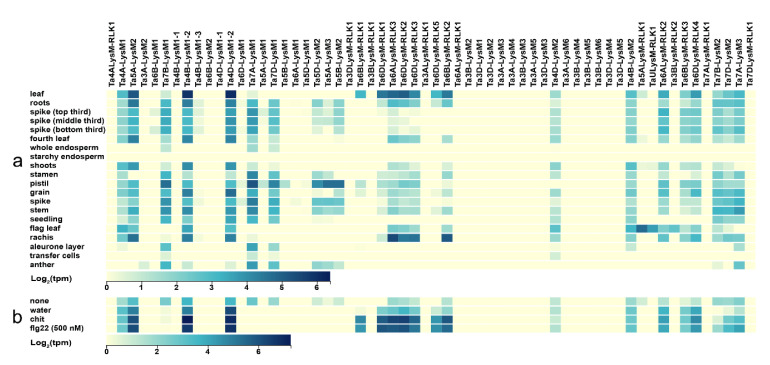
Figure 8.
Expression of LysM genes in wheat. (a) Heat map of expression data in different Chinese spring tissues. (b) Heat map of expression data for different treatments. The blue color stands for high expression and the yellow color represents low expression. Water: water treatment; none: no treatment; chit: chitin; flg22: a polypeptide of flagellin proteins.

