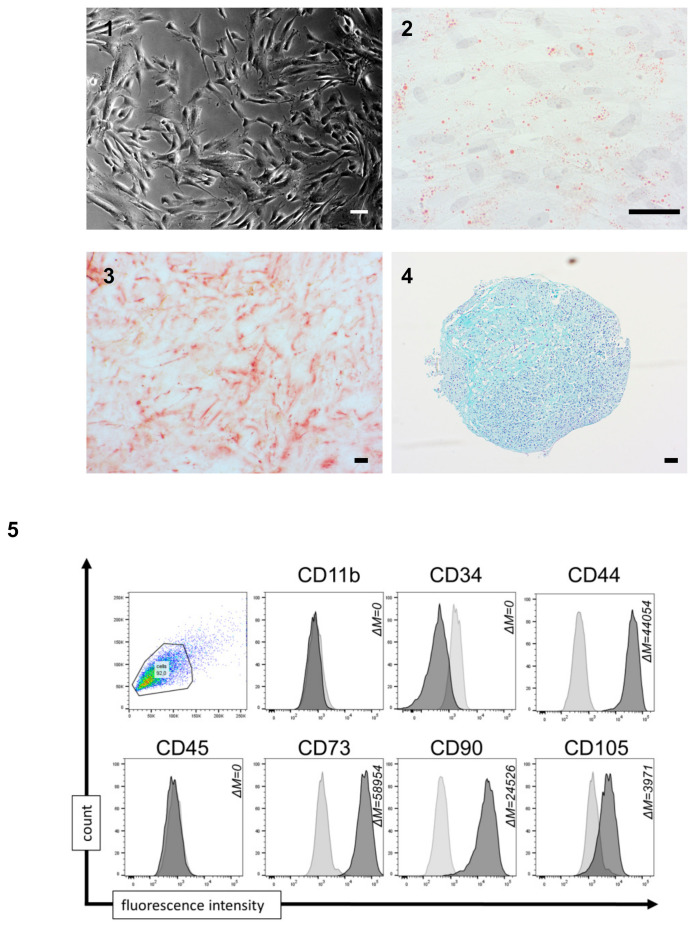
Figure 4.
Characterization of induced pluripotent stem cell-derived mesenchymal stem cells (iP-MSCs). (1) Representative images from differentiated iP-MSCs in passage 3 (iP-MSC 3; scale bar 100 μm). (2–4) Representative images of immunohistochemistry staining of iP-MSCs showing successful differentiation into adipocytes, osteocytes, and chondrocytes. (2) Adipogenic differentiation is detected with Oil Red O staining. (3) Osteogenic differentiation is detected with Alizarin Red, and (4) chondrogenic differentiation is detected with Alcian Blue (scale bars 100 μm). (5) Representative diagrams of flow cytometric analyses of iP-MSCs at passage 3 (n = 4) for cell surface markers being expressed (CD44, CD73, CD90, and CD105) and cell surface markers being absent (CD11b, CD34, and CD45). Data are shown as an overlay histogram with the isotype control (light gray) and cell surface marker staining (dark gray) (ΔM = mean fluorescence intensity, MFI; difference between MFI measure and isotype control).

