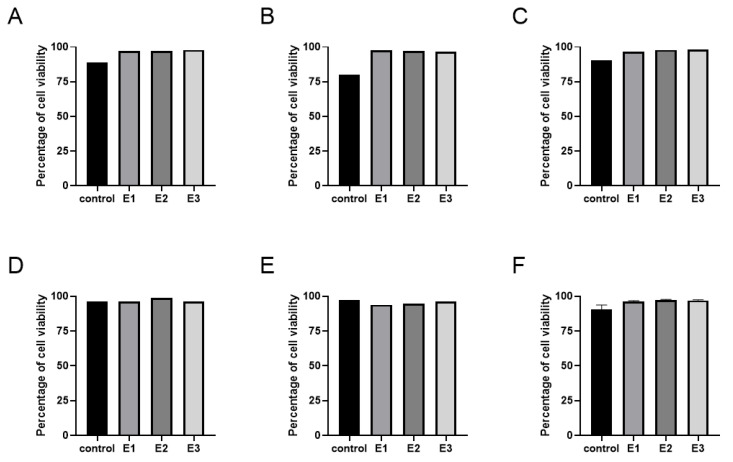
Figure 1.
Cell viability at the end of the 6th passage of the experiment. The graphs demonstrate the percentage of living cells in the population of cell line 1 (A), cell line 2 (B), cell line 3 (C), cell line 4 (D), cell line 5 (E), and as a mean of lines 1–5 with SEM plotted as an error bar (F). Cells were cultivated in a standard medium (control) and experimental media 1–3 (E1–3). No statistical significance between the control and experimental groups was found.

