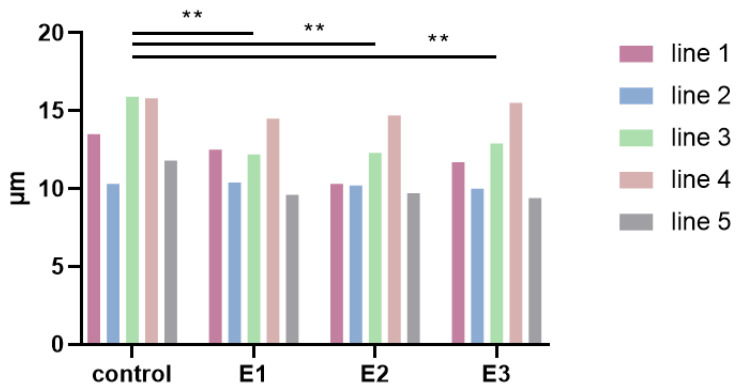
Figure 2.
The median of the cell diameter at the end of the 6th passage. The graph demonstrates cell lines 1–5 cultivated in the control (control) and experimental media 1–3 (E1–3). Statistical analysis between pooled data of the control group and pooled data of experimental groups was performed using one-way ANOVA with Fisher’s Least Significant Difference (LSD) post hoc test; ** p < 0.005.

