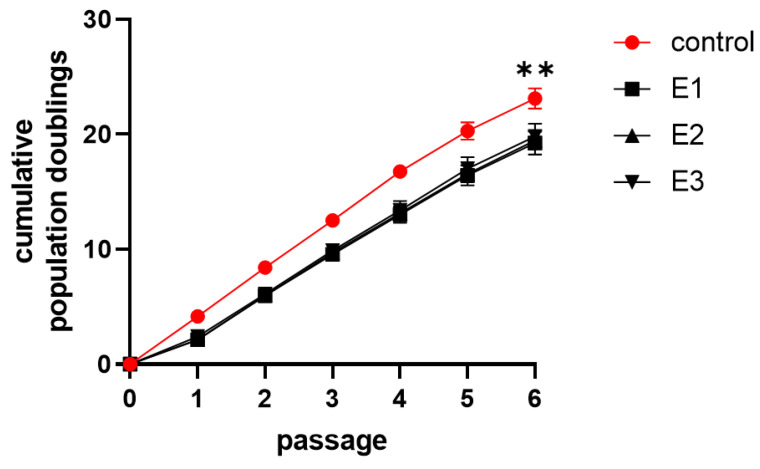
Figure 3.
Cumulative population doublings during the cultivation. The graph demonstrates cumulative proliferation doublings of dental pulp stem cells as a mean of cell lines 1–5 with SEM plotted as error bars in experimental passages. Cells were cultivated in the control (control) and experimental media 1–3 (E1–3). Statistical analysis was performed using Friedman’s test followed by Dunn’s post hoc test; ** p < 0.005. Individual graphs for each cell line are enclosed in supplementary data as Figure S1.

