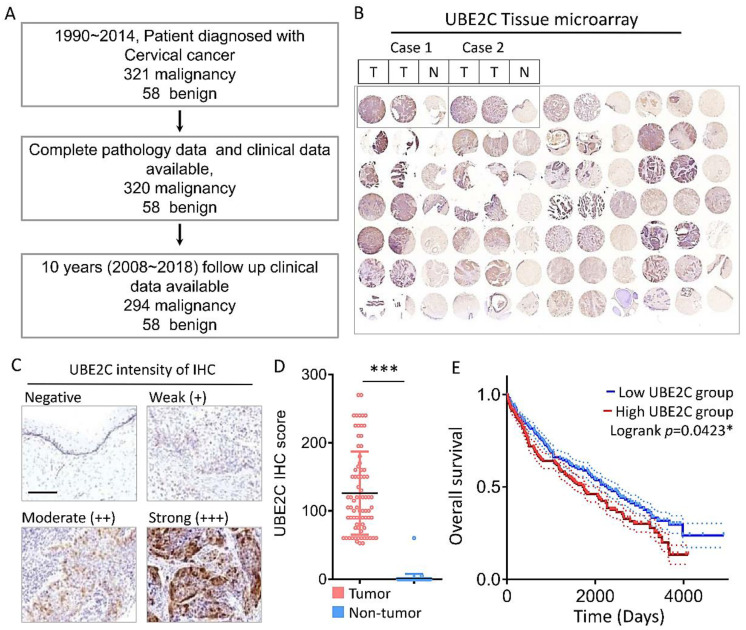
Figure 2.
Diagnostic value of UBE2C expression in tumor biopsies during the development of CESC. (A) Schematic diagram of clinical recruitment for cervical cancer. (B) Comparative representative photomicrographs of UBE2C between normal and CESC tissues. (C) The representative images for negative, weak (+), moderate (++) and strong (+++) staining of UBE2C in CESC tissues. (D) The IHC score of UBE2C expression in CESC tissue and matched adjacent normal tissue. (E) Kaplan-Meier survival curves for disease-specific survival according to UBE2C expression status. * p < 0.05; *** p < 0.001. Scale bars 100 μm.

