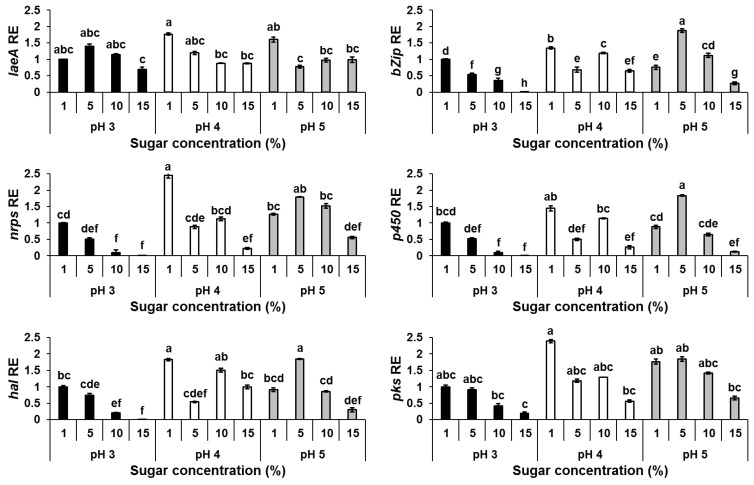
Figure 3.
laeA and OTA gene cluster relative expression as affected by sugar concentrations and pH levels. Solid SGM media was amended with different sugar concentrations. The media was inoculated with 100 µL of a 106 spore/mL suspension and the relative expression of laeA, bZIP, nrps, p450, hal and pks genes were compared at different conditions. RNA was extracted from mycelia at day 6 post-inoculation. Relative expression was normalized using β-tubulin as an internal control. The expression of each gene under sugar concentration of 1% at pH 3 was normalized as 1.0. Error bars represent standard error of three independent biological replicates. Different letters above the columns indicate statistically significant differences at p < 0.05, as determined using the Tukey’s honest significant difference test.

