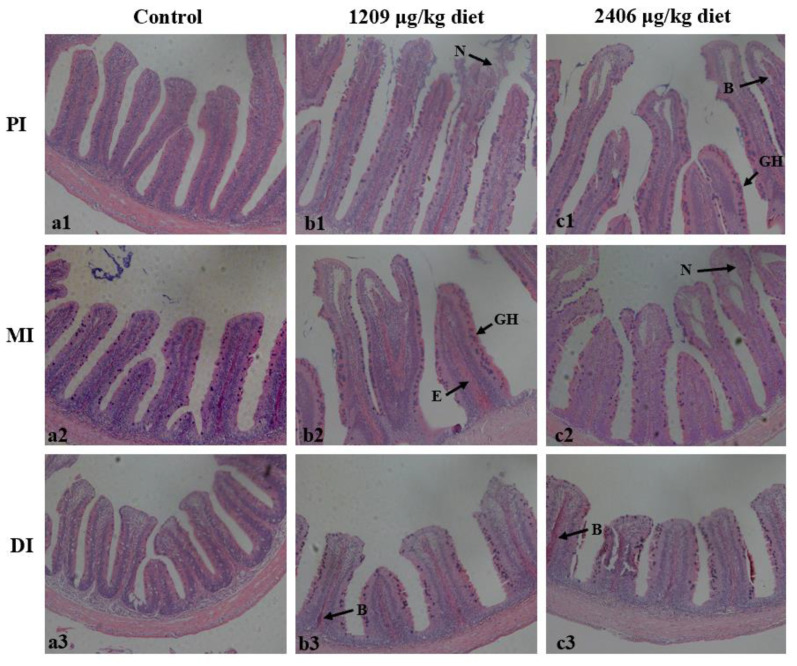
Figure 3.
The histology analysis of the PI, MI and DI in juvenile grass carp fed diets containing graded levels of OTA (µg/kg diet) for 60 days. Control (a1–a3), 406 µg/kg of diet (b1–b3); 2406 µg/kg (c1–c3) of diet. In each panel, N: necrosis; GH: goblet cell hyperplasia; B: blood capillary hyperemia; and E: edema in the lamina propria. H&E staining; magnification × 200.

