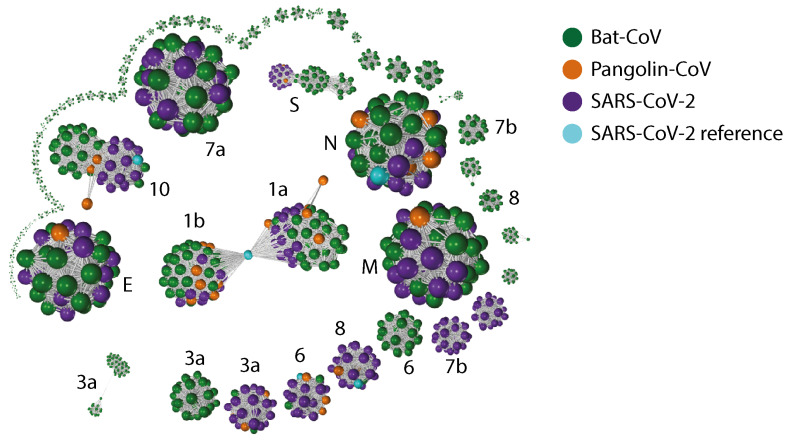
Figure A2.
Gene–gene similarity network analysis. Each node represents a amino acid sequence defined by PROKKA or BLAST (ORF10 and E). The nodes were compared against each other using BLAST, and nodes with high similarity (bit score ≥ 60 and a query coverage ≥80%) were connected with an edge. The network graph is labelled with with SARS-CoV-2 gene names (“ORF” omitted). When the network graph is coloured by host species, genes showing higher degree of variability across species are highlighted. Similar to the network analysis on nucleotide sequences (Figure 2). Genes ORF3a, ORF6, ORF7b, ORF8, ORF10 and S show strong separation between nodes from different species. The degree of separation in ORF1ab are stronger than ORF10 in the nucleic acid network graph; the reverse is true for the amino acid network graph.

