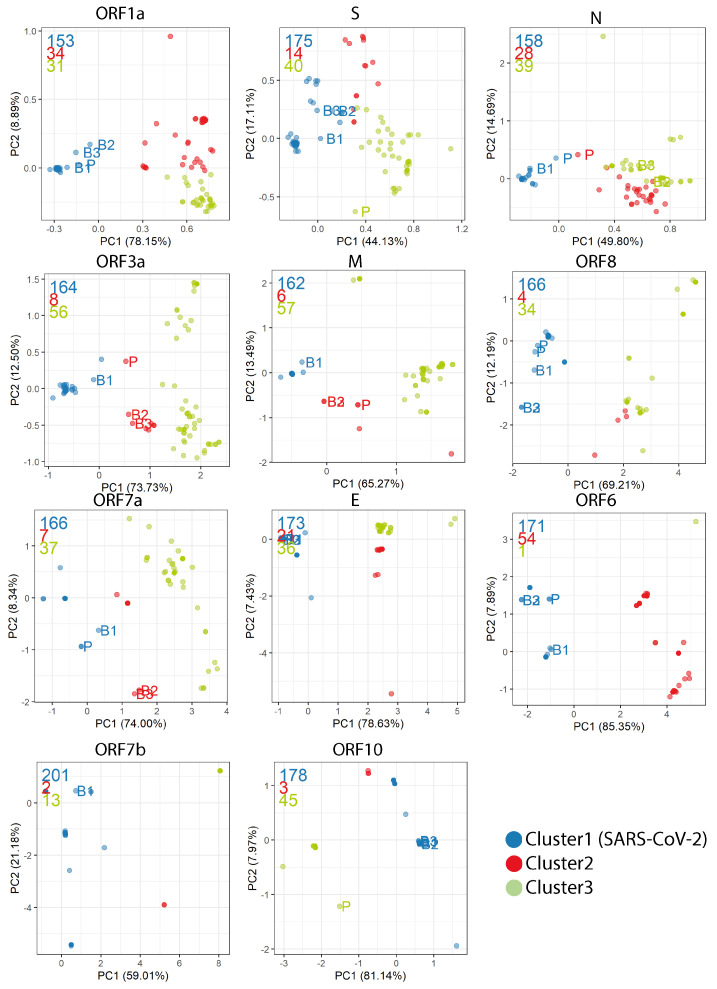
Figure A3.
Relative synonymous codon usage (RSCU) was calculated as the ratio of the observed frequency of codon to the expected frequency under the assumption of equal usage between synonymous codons for the same amino acids. For each gene, Principal Component Analysis (PCA) was carried out on the RSCU values, and the first 10 Principal Components (PCs) were used to group the genomes into 3 clusters through kmeans clustering. The cluster with the most number of SARS-CoV-2 genomes is labelled as Cluster 1. Clusters 2 and 3 are assigned according their PC1 and PC2 distance to Cluster 1, with Cluster 2 being closer. Four isolates are labelled: bat-RaTG13 (B1), bat-SL-CoVZC45 (B2), bat-SL-CoVZXC21 (B3), and pangolin-MP789 (P; MT121216.1 and MT084071.1). These 4 isolates are closer to SARS-CoV-2 than other bat-CoV and pangolin-CoV. The number of genomes in Clusters 1, 2 and 3 are indicated in order on the top left corner of each graph.

