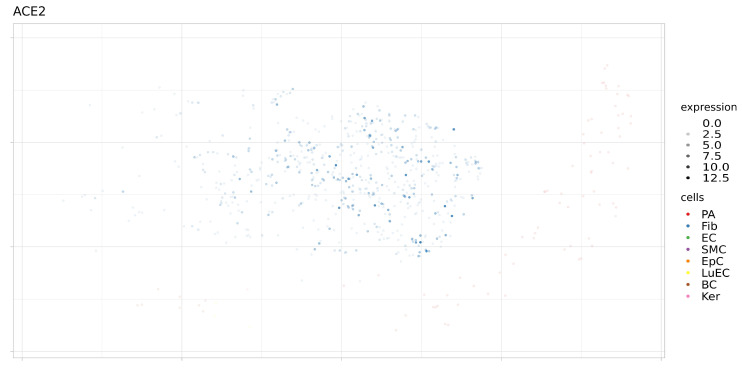
Figure 7.
Expression levels ACE2 in separate cells of proximal stromal lung (SRS2769051). PA, pulmonary alveolar type II cells; Fib, fibroblasts; EC, endothelial cells; SMC, smooth muscle cells; LuEC, luminal epithelial cells; BC, basal cells; Ker, keratinocytes. Color intensity indicates the level of expression in a single cell.

