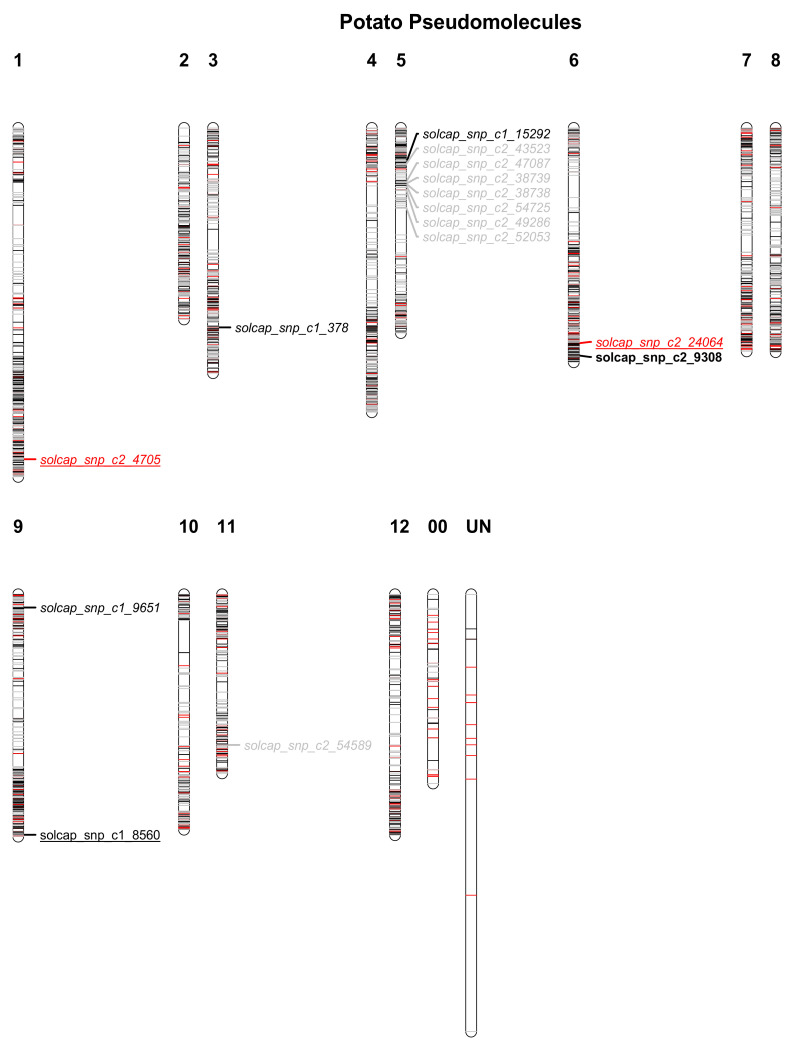
Figure 3.
Distribution of SNP markers from three sets of linkage disequilibrium (LD) pruning over the 14 (1–12, 00 and UN) potato pseudomolecules previously mapped. The displayed markers are from three distinct square correlation coefficient (r2) LD thresholds for SNP filtering; 5000 SNPs were extracted by LD pruning at r2 = 1 (grey), 2000 SNPs at r2 = 0.446 (black) and 500 SNPs at r2 = 0.084 (red). Significant SNPs from all thresholds are mapped underlined and italic flowering time, italic tuber number, bold tuber weight, and underlined susceptibility to Phytophthora infestans causing late blight in potato.

