
Figure 2.
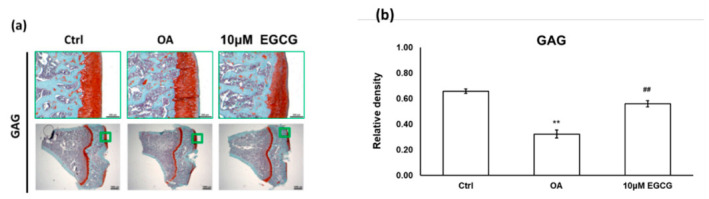
The histological analysis of osteoarthritis (OA) and the quantitative assessment of glycosaminoglycan (GAG) loss in the anterior cruciate ligament transection (ACLT) rats. (a) The representative micrographs of the proximal tibial cartilage with safranin O-fast green staining. (b) The quantitative analysis of GAG loss. No obvious arthritic changes or GAG loss was observed in the control group, but marked GAG loss was observed in the knee joints of ACLT rats. Meanwhile, the GAG loss was reduced after EGCG treatment. (** p < 0.01 OA vs. control; ## p < 0.01 OA vs. EGCG).