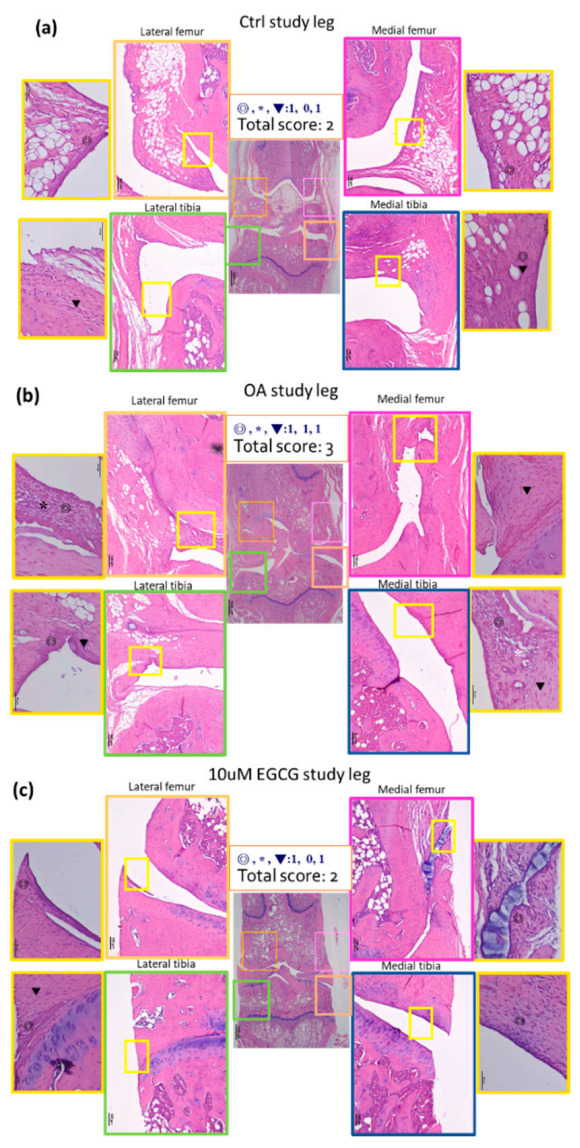
Figure 4.

Representative sections of synovial membrane from both knee joints of rats. (a) Sample from a rat after sham operation (control group). Note the low-grade inflammatory cell infiltrate and the mild increases of synovial hyperplasia and stroma activation. (b) Sample from a rat after anterior cruciate ligament transection (OA group), in which there is more infiltration by inflammatory cells. (c) Sample from a rat after ACLT and treated with EGCG (10 μM EGCG group) shows similar sham-operated joints with a fewer infiltrating cells than the OA joint.
