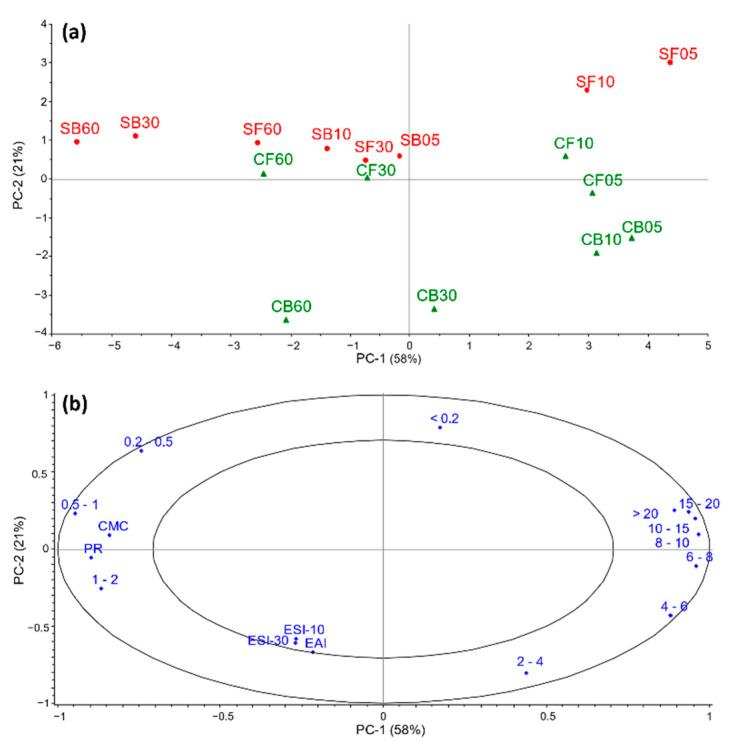
Figure 1.
Principal component analysis score plot (a) shows similarities and differences between salmon (S) and cod (C) backbone hydrolysates made with FoodPro PNL (F) and Bromelain (B) for 5, 10, 30 and 60 min. The correlation loading plot (b) illustrates associations between molecular weight distribution (kDa), protein recovery (PR), critical micelle concentration (CMC), emulsion stability after 10 min (ESI-10), emulsion stability after 30 min (ESI-30), and emulsion activity index (EAI). The two ellipses represent 50% and 100% of explained variance.

