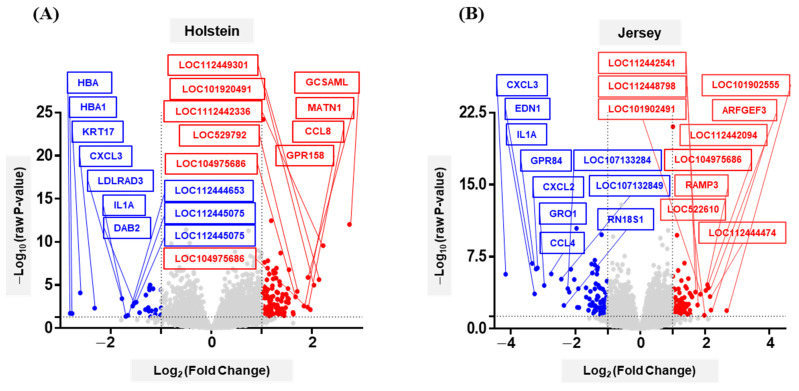
Figure 3.
Volcano plots showing heat-stress-responding differentially expressed genes in Holstein and Jersey PBMCs. The DEGs in Holstein (A) and Jersey (B) PBMCs are presented in volcano plots (p < 0.05, fold-change < −2 or > 2). The top ten down-regulated (blue) or up-regulated (red) genes are highlighted.

