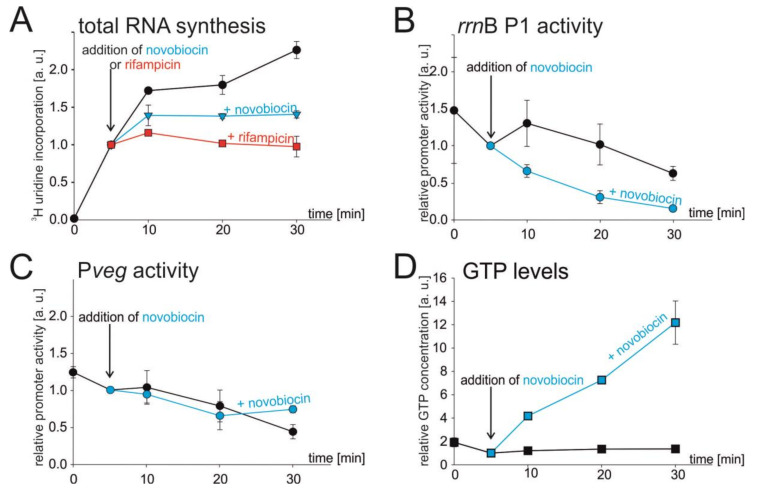
Figure 2.
Effect of novobiocin-induced relaxation of chromosome on total RNA synthesis, selected promoter activities, and GTP level. (A–D) Cells were grown to early exponential phase (OD600 ~0.3), and at time 5 min they were treated with novobiocin (5 μg/mL). (A) Total RNA synthesis after novobiocin treatment. After 3H-uridine had been added (time 0), the culture was divided into three flasks. At time 5 min the cells were treated with novobiocin (blue line) or with rifampicin (red line) as a control, or left untreated (black line). The amount of radiolabeled RNA at 5 min was set as 1. Black circles, mock-treated; blue triangles, treated with novobiocin; red squares, treated with rifampicin. The values are averages of three independent experiments ±SD. (B,C) The relative activities of rrnB P1 and Pveg promoters after novobiocin treatment. Cells were grown and at 5 min treated with novobiocin or not. RNA was extracted and determination of promoter activity was done by RT-qPCR. Promoter activities were set as 1 at time 5 min. Blue lines are novobiocin-treated samples, black lines are untreated samples. The experiment was performed three times. The error bars show ±SD. (D) GTP concentration after novobiocin treatment. Cells were grown in the presence of [32P] H3PO4 and treated with novobiocin. Levels of GTP were determined by TLC. The GTP level at 5 min was set as 1. Results are averages from two measurements. The error bars show the range.

